Weekly Report | Sep 15, 2024
What is included in this week's edition?
WEEKLY REVIEW: An overview of current market standing, fundamental matters with implications upon the market, and general sentiment regarding the major US indices.
LOOKING AHEAD: Key takeaways to consider as we look forward to the upcoming trading week.
MARKETS: A technical review of the major indices and commodities that represent the overall health of the market.
Market Trader by MyntBit
Stocks saw a steady rise throughout the week as August's Consumer Price Index (CPI) and Producer Price Index (PPI) data confirmed that inflation continues to move in the right direction, despite a slight upside surprise in month-over-month core CPI tempering the overall impact. Overall, the inflation reports were well-received, providing the final key indicator to support expectations for a rate cut at the Federal Reserve's (Fed) policy meeting next week. In other data, consumer sentiment improved according to the University of Michigan, with a decline in year-ahead inflation expectations, though consumer credit showed increased credit utilization. Additionally, the National Federation of Independent Business (NFIB) Small Business Optimism Index fell, reflecting concerns over the labor market and sales outlook.
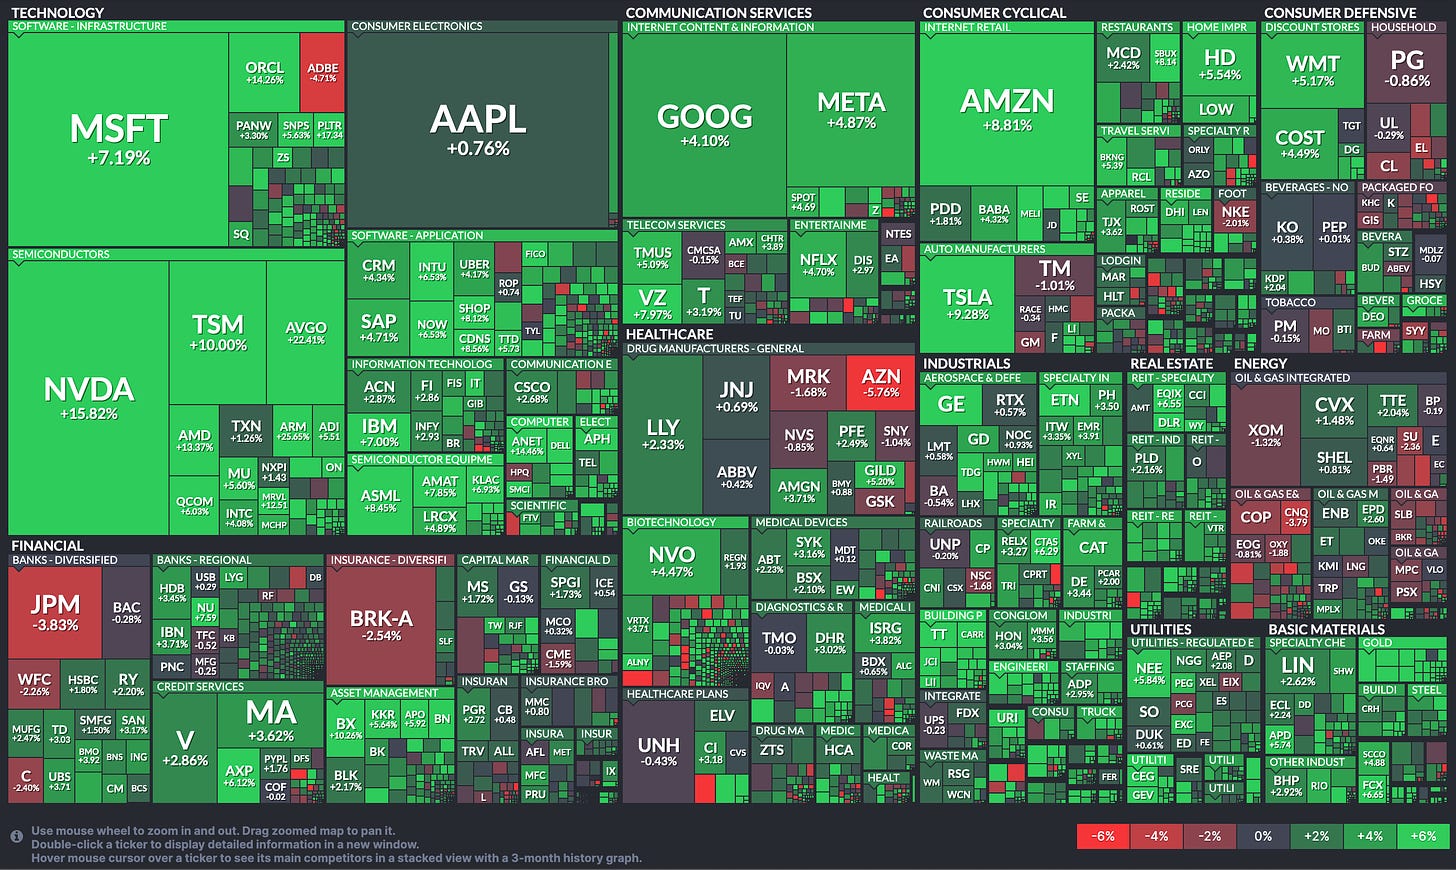
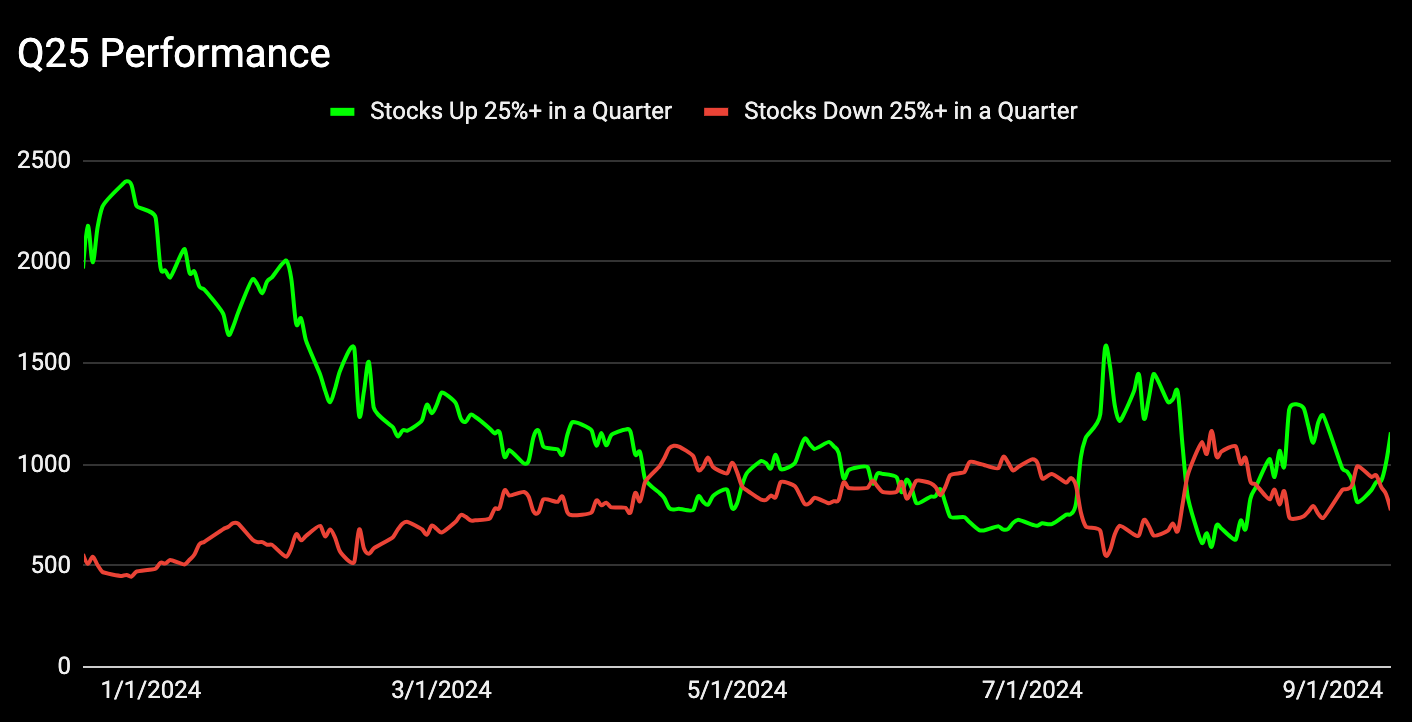
Overall Stock Market Heatmap
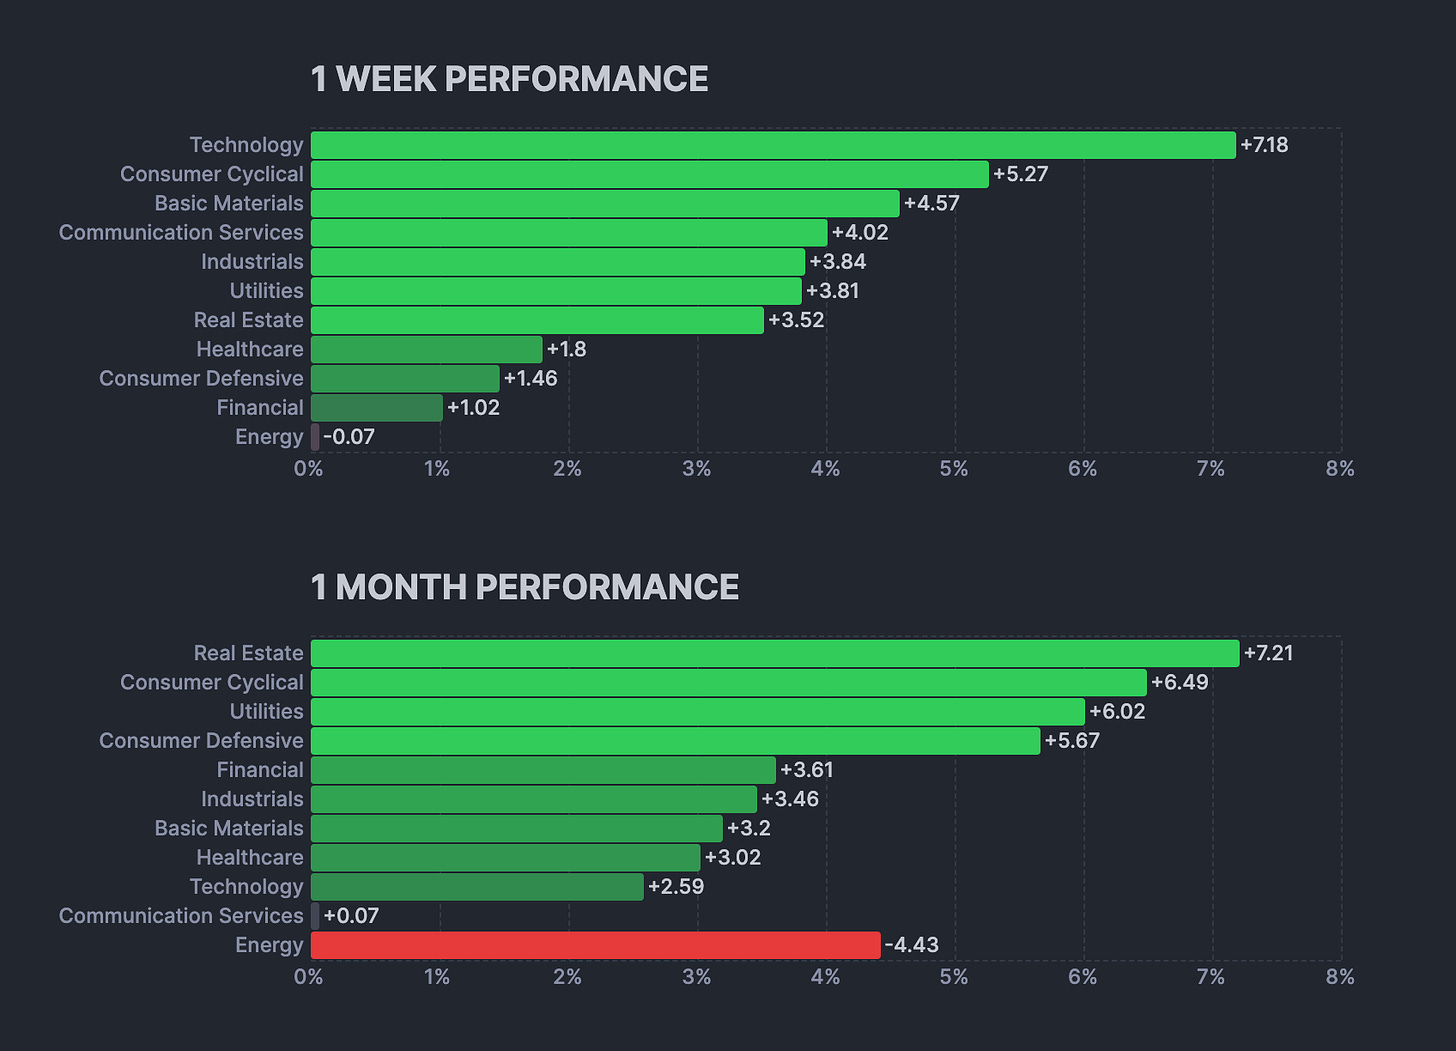
Sector Performance
Looking Ahead to the Upcoming Week
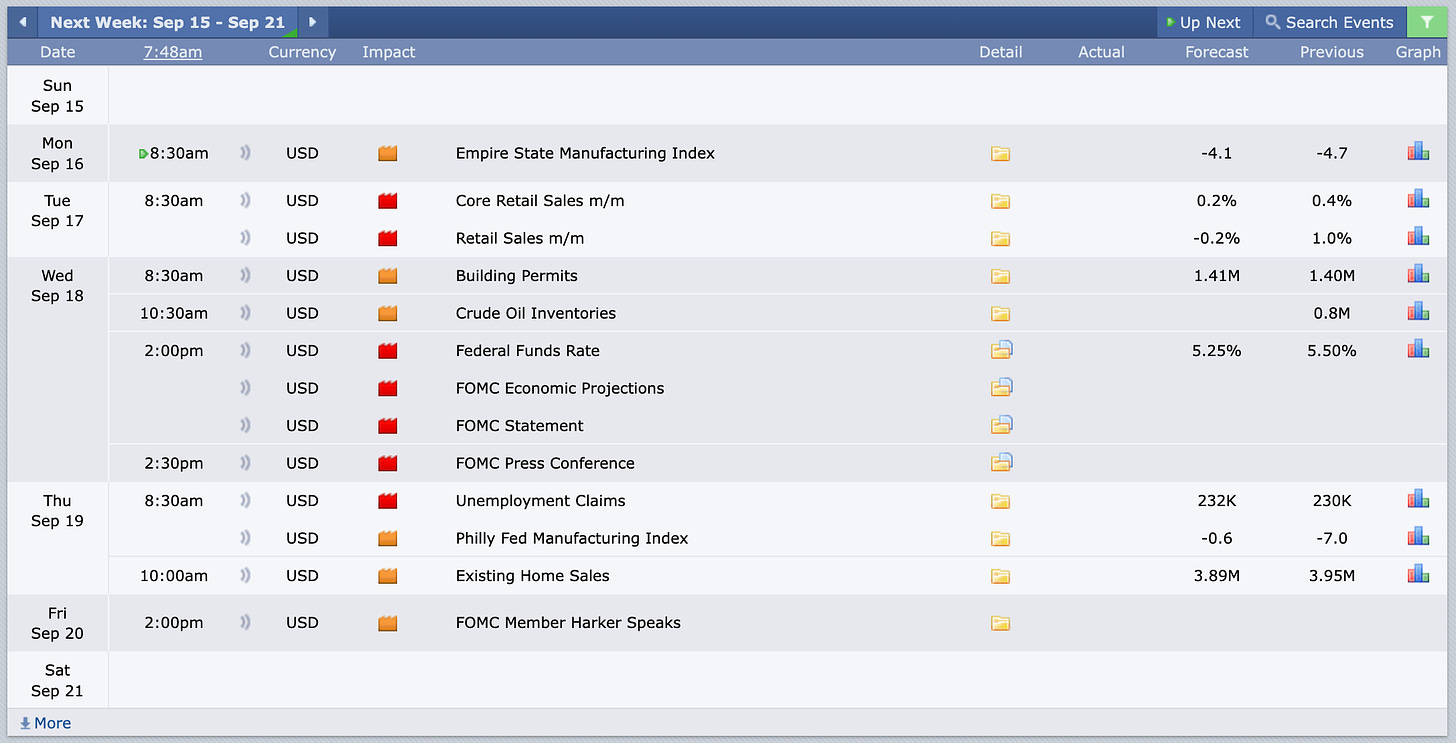
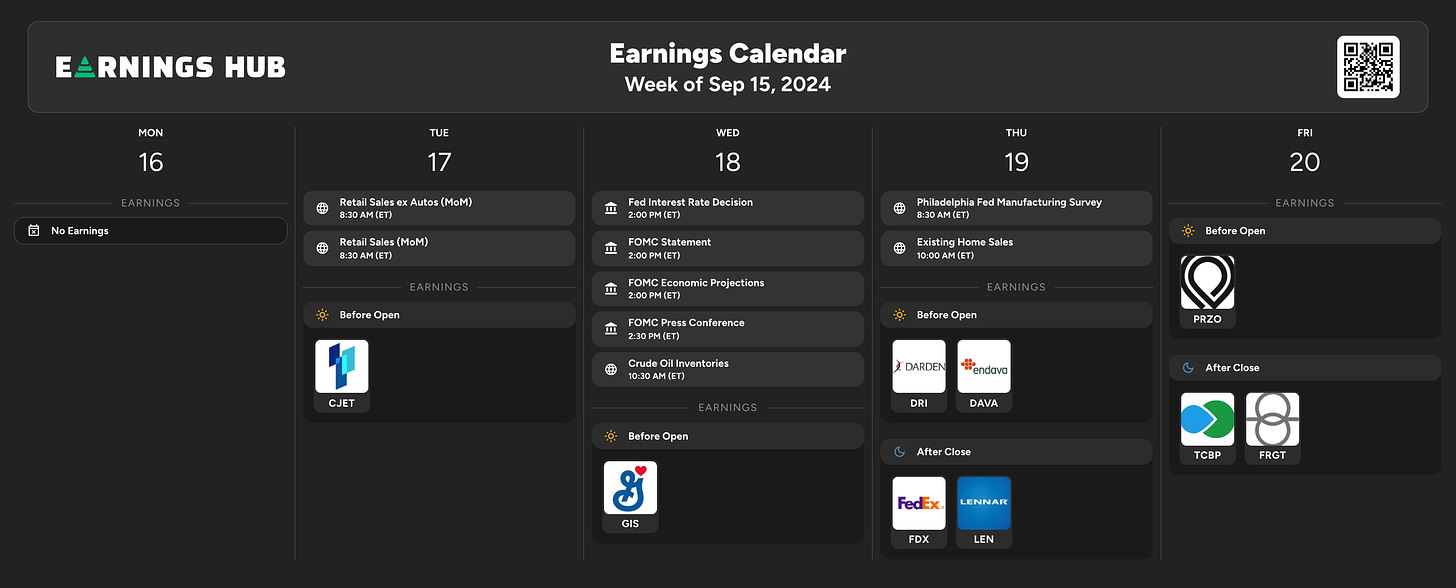
Looking ahead to next week, investors will turn their attention to the Federal Open Market Committee’s policy decision on Wednesday, as well as August retail sales data. Other notable updates will include housing market indicators such as housing starts and existing home sales, along with industrial production figures.
Economic Events
Earnings Event
Markets
Below are the levels for the upcoming week. Updates will be provided on X (previously Twitter) throughout the week.
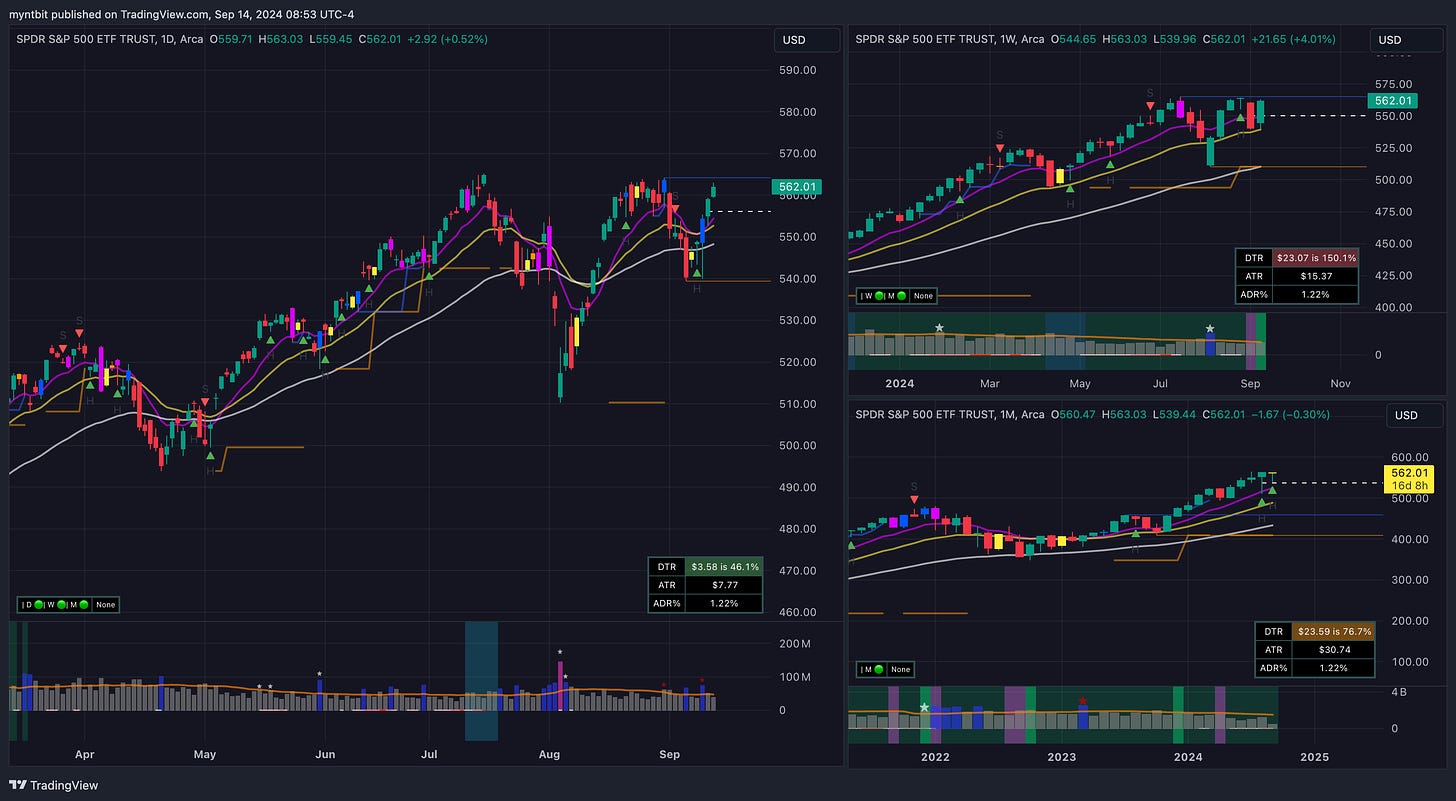
SPY - SPDR S&P 500 ETF Trust
Short Term (1-2 weeks): Bullish. The stock is in an uptrend, and a break above $565 could trigger further upside toward $570-575.
Medium Term (1-3 months): Bullish. As long as SPY holds above $540, the uptrend should continue, with potential targets above $570.
Long Term (3+ months): Bullish. The long-term trend is positive, and unless $520 breaks, the ETF remains poised for more gains.
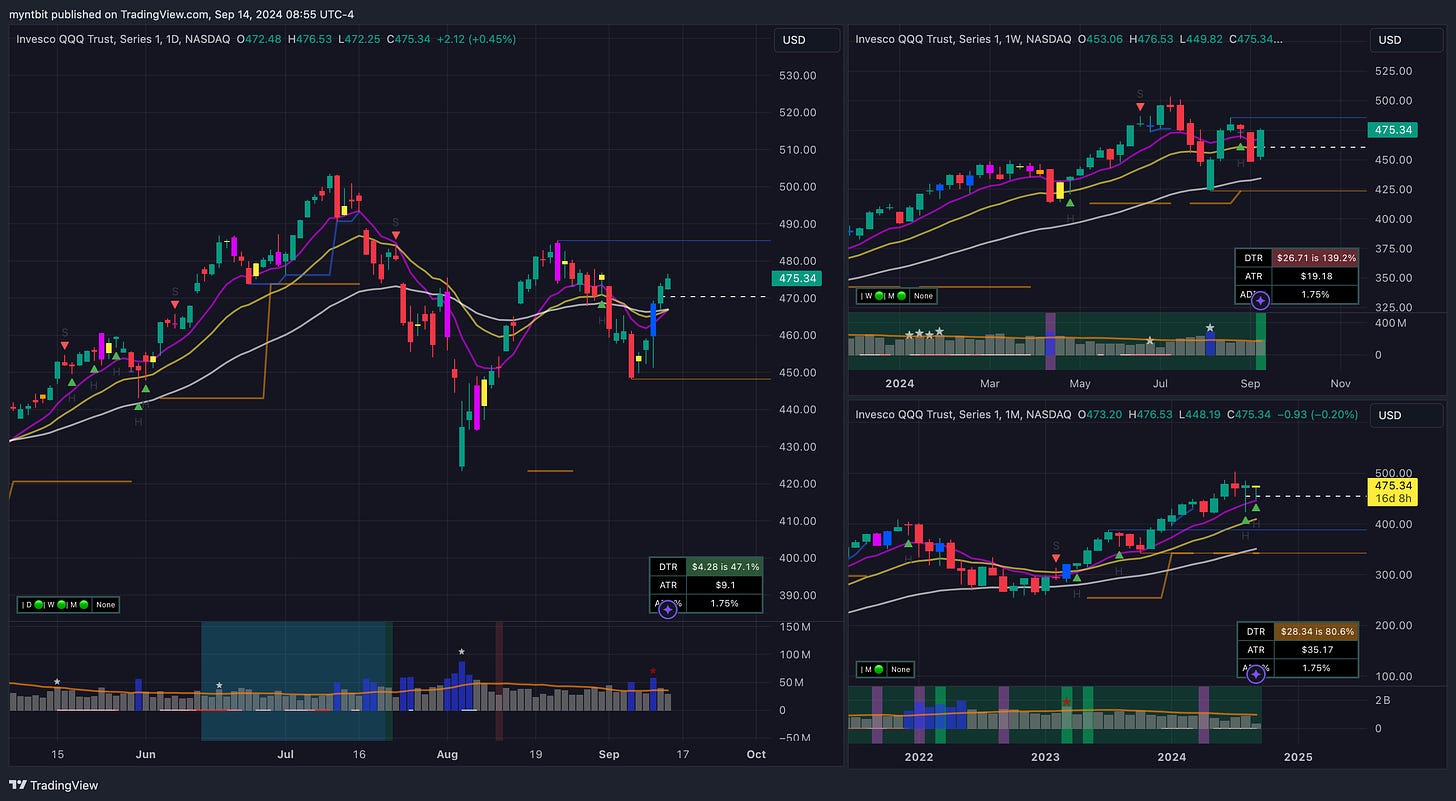
QQQ - Invesco QQQ Trust Series 1
Short Term (1-2 weeks): Bullish. QQQ is approaching key resistance at $480. If it breaks through, the upside could extend to $500.
Medium Term (1-3 months): Bullish. As long as QQQ holds above $450, the trend is upward, with the potential to reach $500.
Long Term (3+ months): Bullish. The long-term trend is intact, with the next major target being $500, provided the price remains above $450.
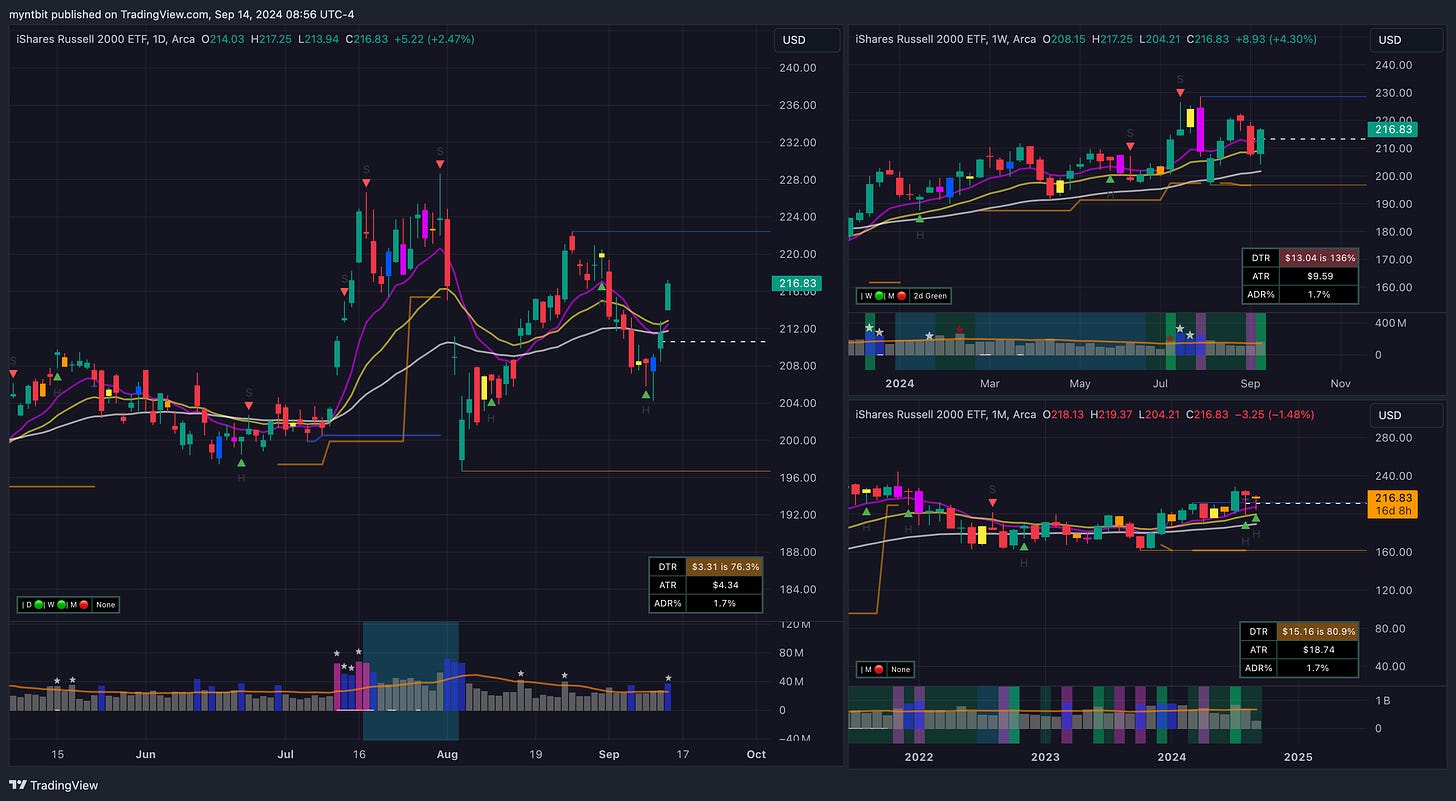
IWM - iShares Russell 2000 ETF
Short Term (1-2 weeks): Bullish. IWM is showing strong momentum, and a breakout above $220 could lead to a move toward $230.
Medium Term (1-3 months): Bullish. As long as IWM holds above $208, the medium-term trend is upward, targeting $230-240.
Long Term (3+ months): Bullish. The long-term uptrend remains intact, with the next significant target at $250, provided the price stays above $200.
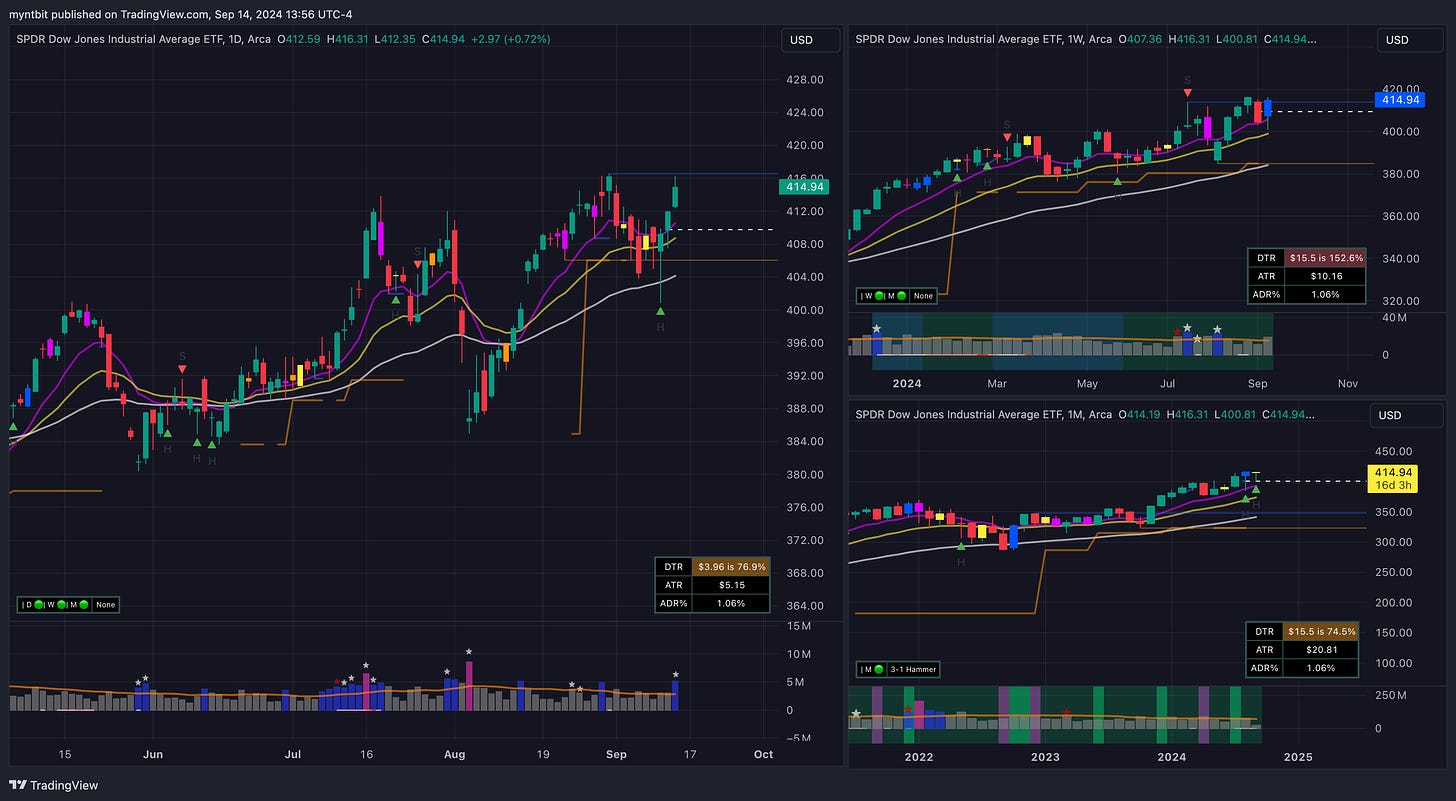
DIA - SPDR Dow Jones Industrial Average ETF Trust
Short-term (1-2 weeks): Bullish with caution. The inverse head-and-shoulders pattern on the daily chart, combined with support from the moving averages, suggests more upside if $416 is broken. However, keep an eye on the $420 resistance level.
Medium-term (1-2 months): Neutral to Bullish. If the price breaks through $420, the medium-term outlook becomes more bullish. Otherwise, consolidation or a pullback to $400 is possible.
Long-term (6+ months): Bullish. The uptrend is clear on the monthly chart, and as long as the price remains above key supports at $400 and $380, the outlook remains positive for long-term investors.
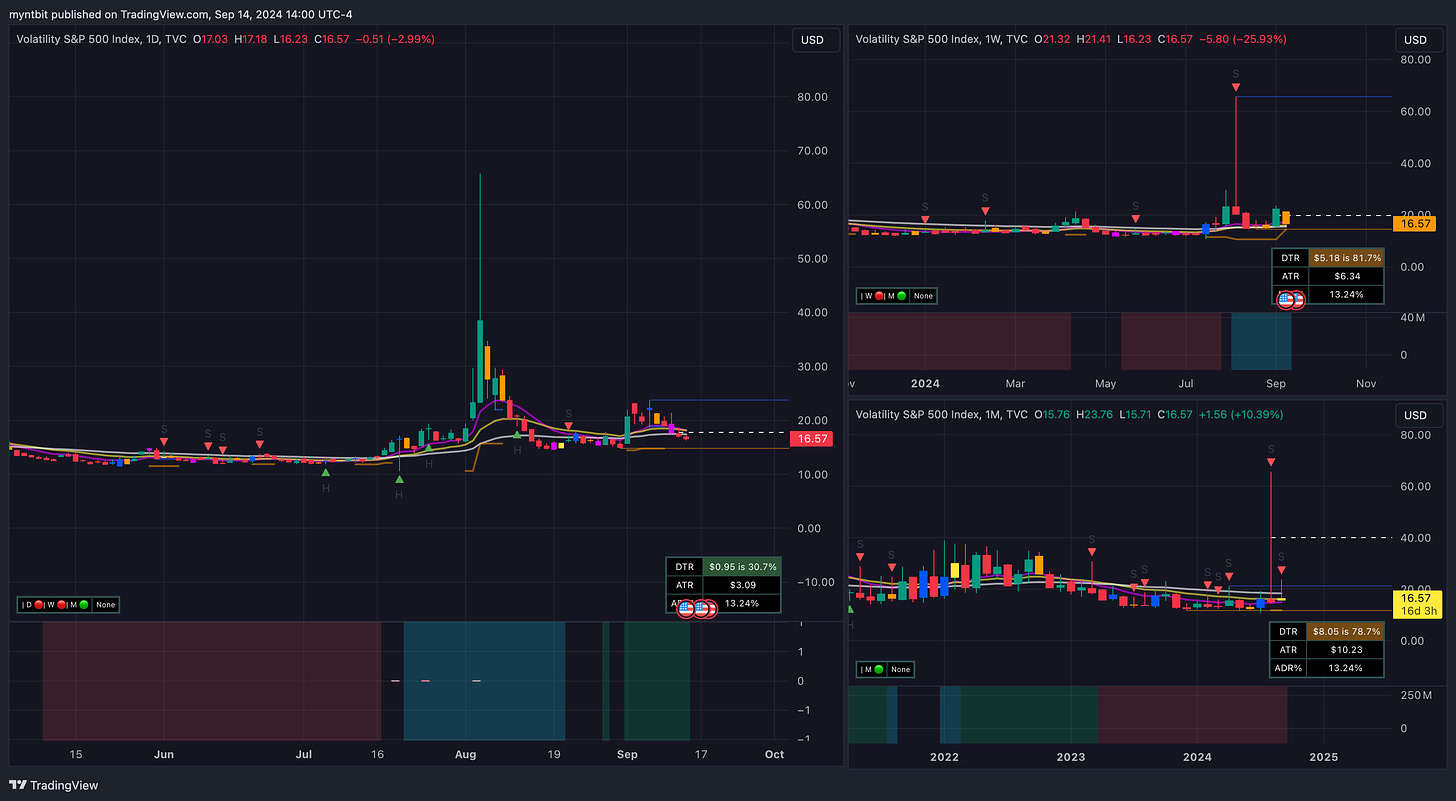
VIX - Volatility S&P 500 Index
Short-term (1-2 weeks): Bearish on volatility. The VIX is testing support at $16, and unless there is an external shock, it is likely to hover around this level or decline further toward $15. However, this remains a key support level, so a rebound is always possible.
Medium-term (1-2 months): Neutral to Bearish. With the VIX sitting at the lower end of its range and no immediate catalysts, volatility is likely to remain subdued. If no major events occur, we could see the VIX continue to drift lower or consolidate in the $15-$20 range.
Long-term (6+ months): Neutral. While the VIX remains low, long-term investors should remain cautious. Historically, the VIX has spiked during times of market stress, and as the chart indicates, it can rise quickly from current levels if a macroeconomic event triggers uncertainty.


