Weekly Report | Jul 21, 2024 + MRNA, DAL, CHWY
What is included in this week's edition?
WEEKLY REVIEW: An overview of current market standing, fundamental matters with implications upon the market, and general sentiment regarding the major US indices.
LOOKING AHEAD: Key takeaways to consider as we look forward to the upcoming trading week.
MARKETS: A technical review of the major indices and commodities that represent the overall health of the market.
Market Trader by MyntBit | Issue# 28
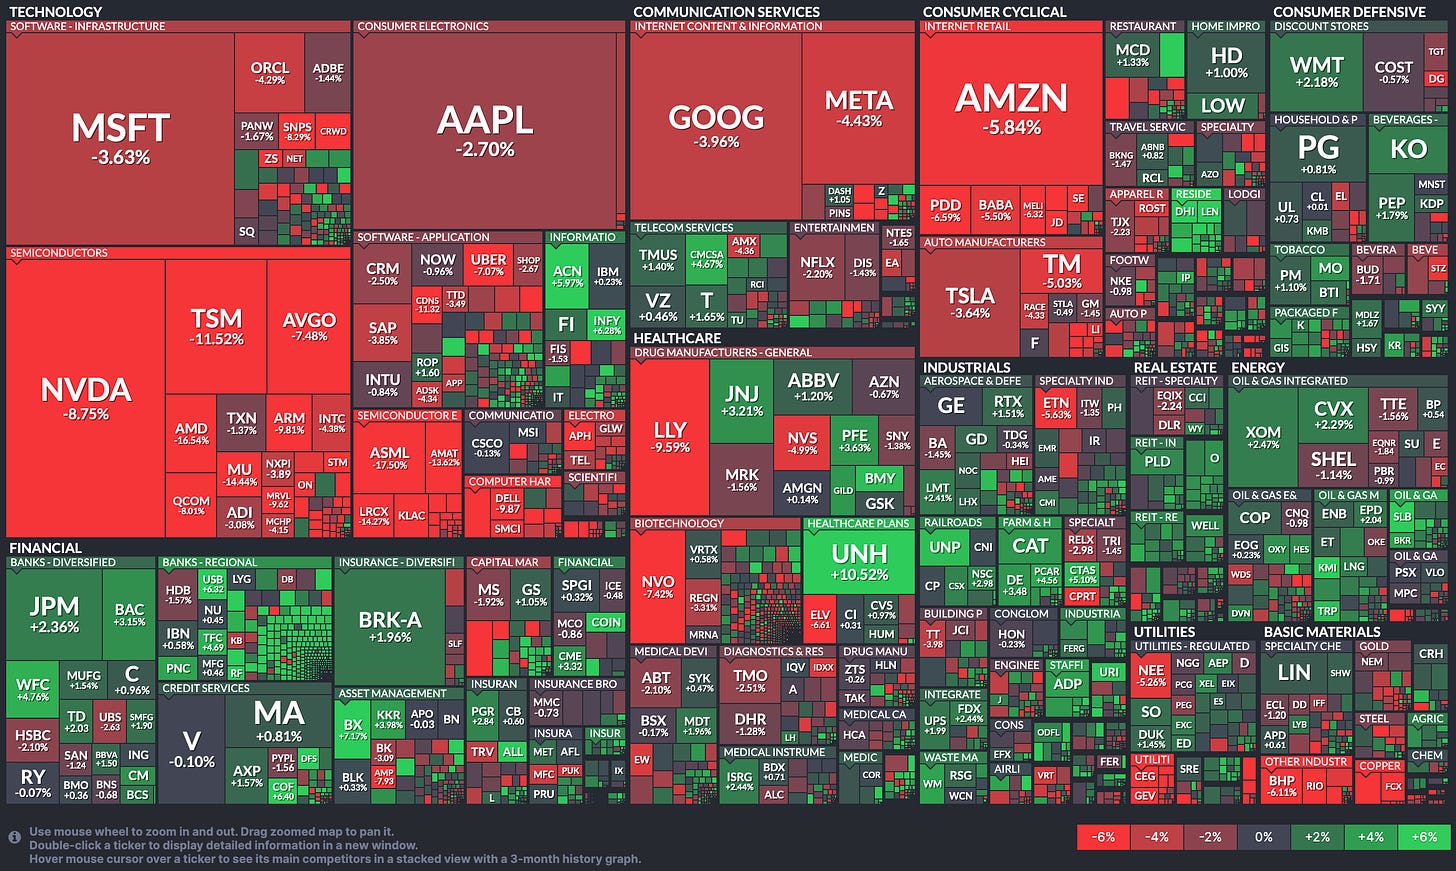
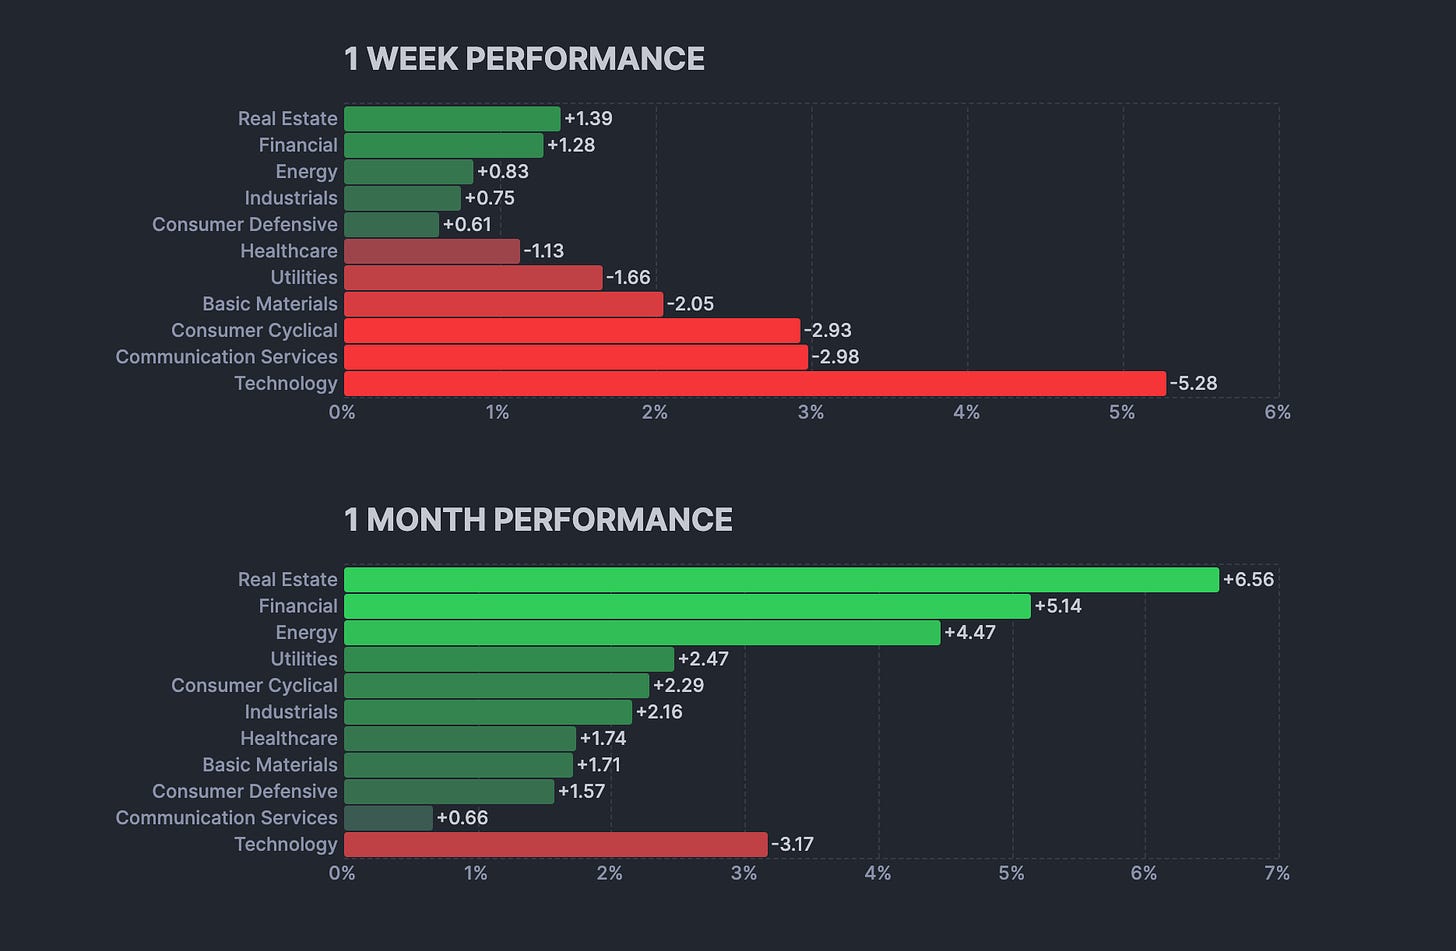
Stocks declined mostly on a week-over-week basis as Big Tech companies struggled, and investors faced political uncertainties and changing monetary-policy expectations. This shift led to a rotation from growth and tech stocks into value and small-cap stocks. Despite mixed economic data, the overarching trend shows a slowing economy, which fuels optimism that inflation will continue to decline and lead to potential rate cuts. Additionally, recent comments from Federal Reserve officials were interpreted as supportive of a rate cut in September.
Overall Stock Market Heatmap
Sector Performance
Looking Ahead to the Upcoming Week
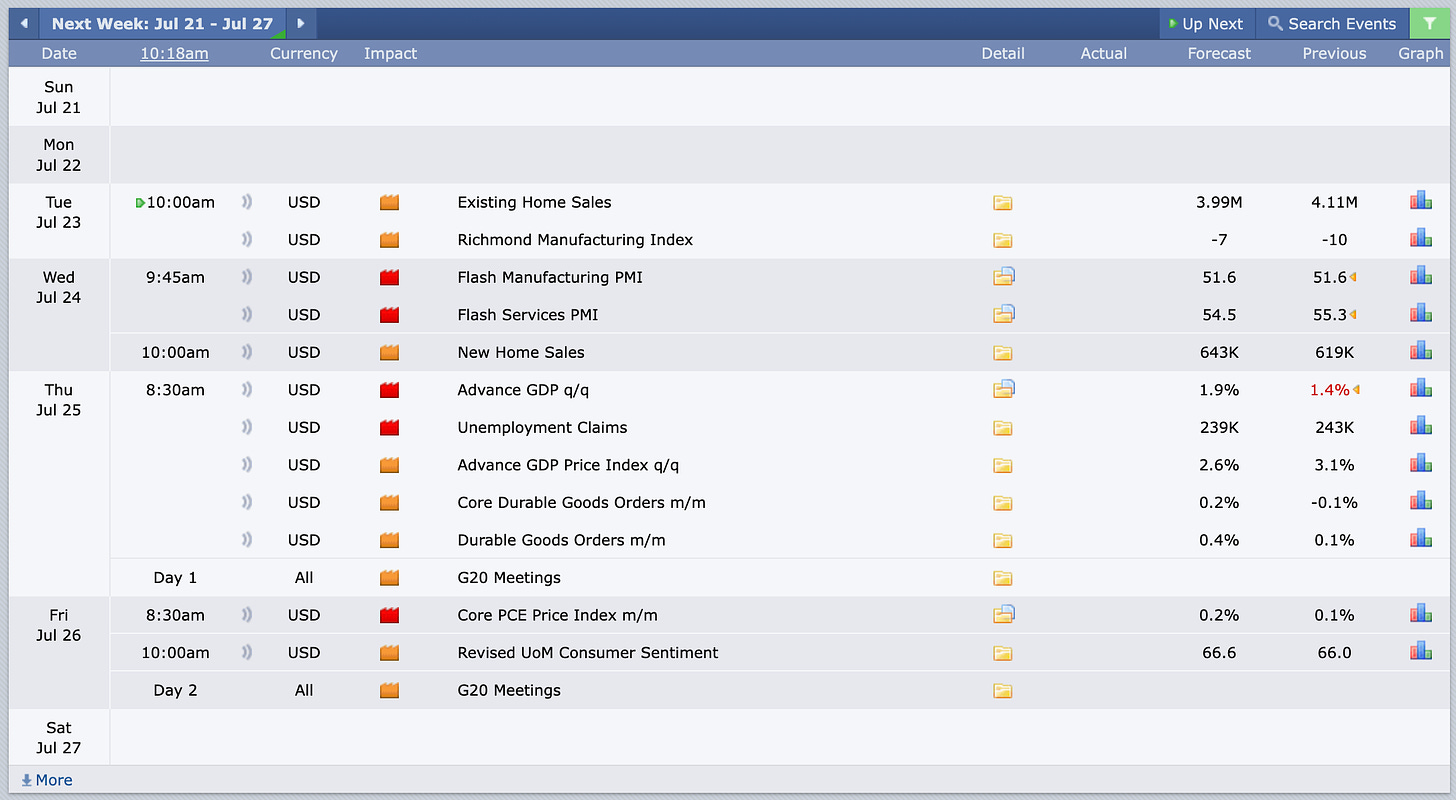
Looking ahead to next week, key focus areas will be the personal consumption expenditures (PCE) inflation data for June and the first estimate of second-quarter gross domestic product (GDP). Other significant releases will include S&P Global’s preliminary Purchasing Managers’ Indexes (PMIs) for July, housing-market updates, durable goods orders, and wholesale inventories.
Economic Events
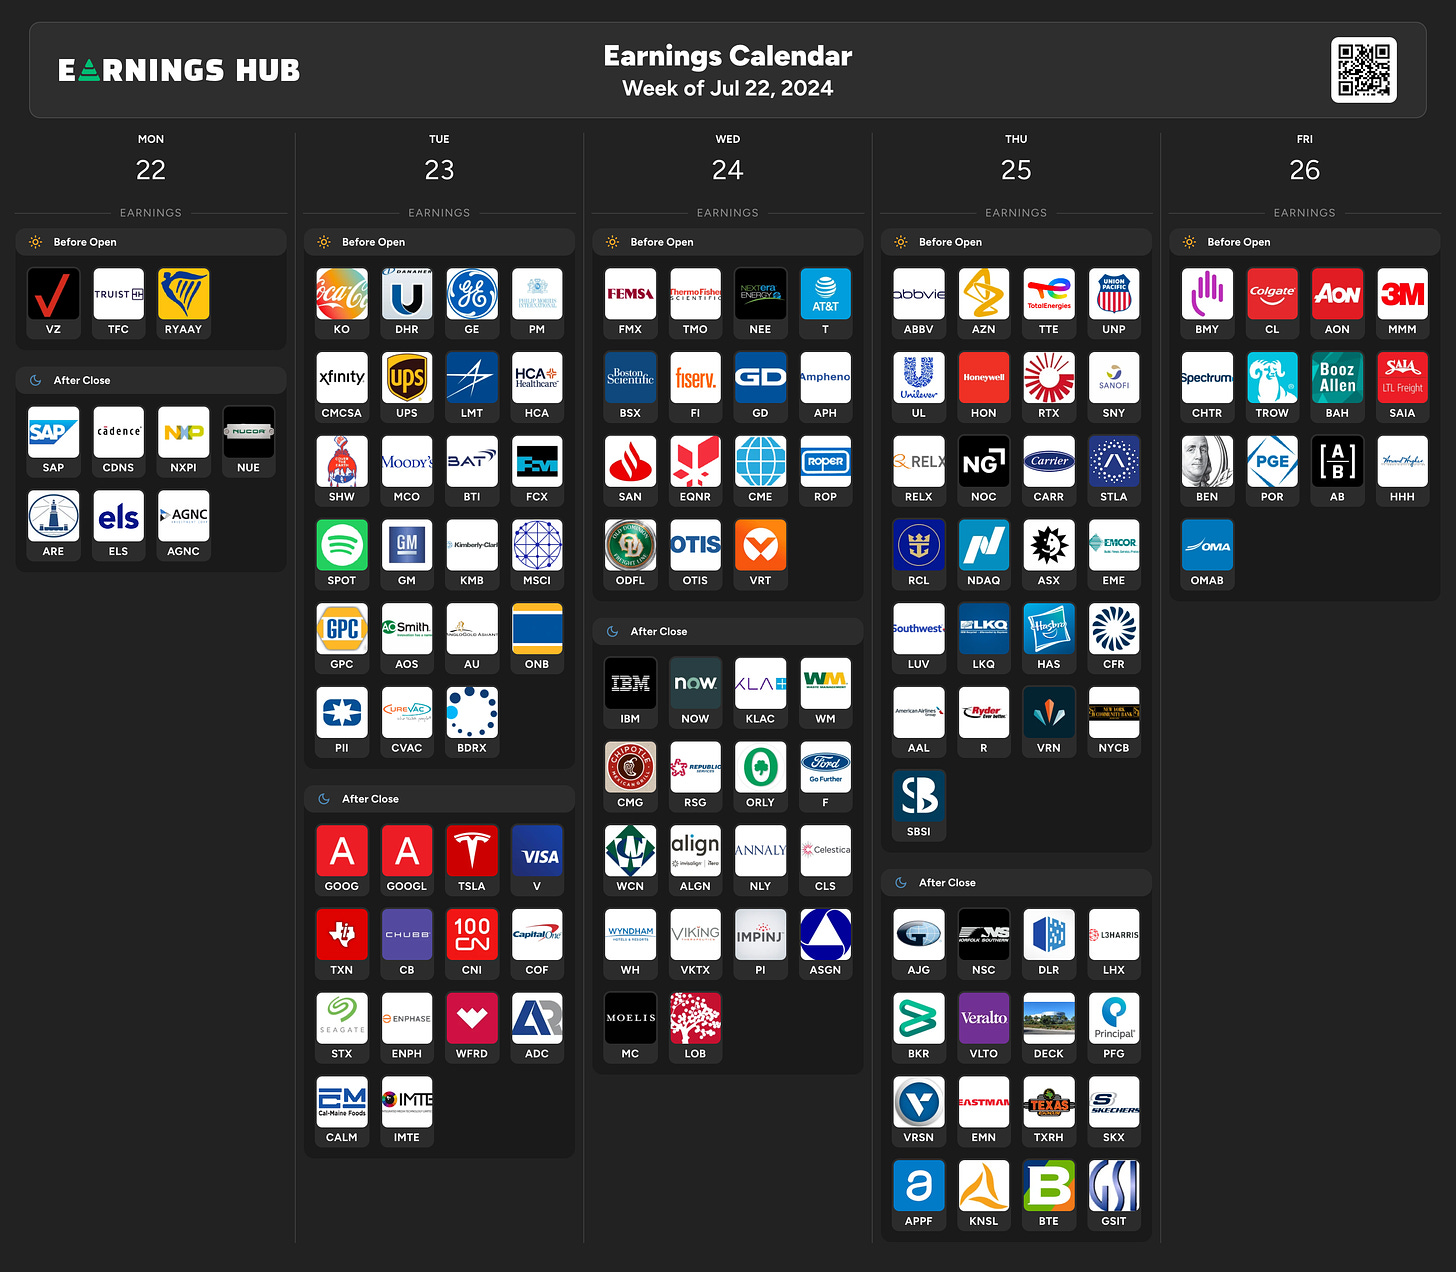
Earnings Event
Markets
Below are the levels for the upcoming week - updates will be provided on X (previously Twitter) throughout the week.
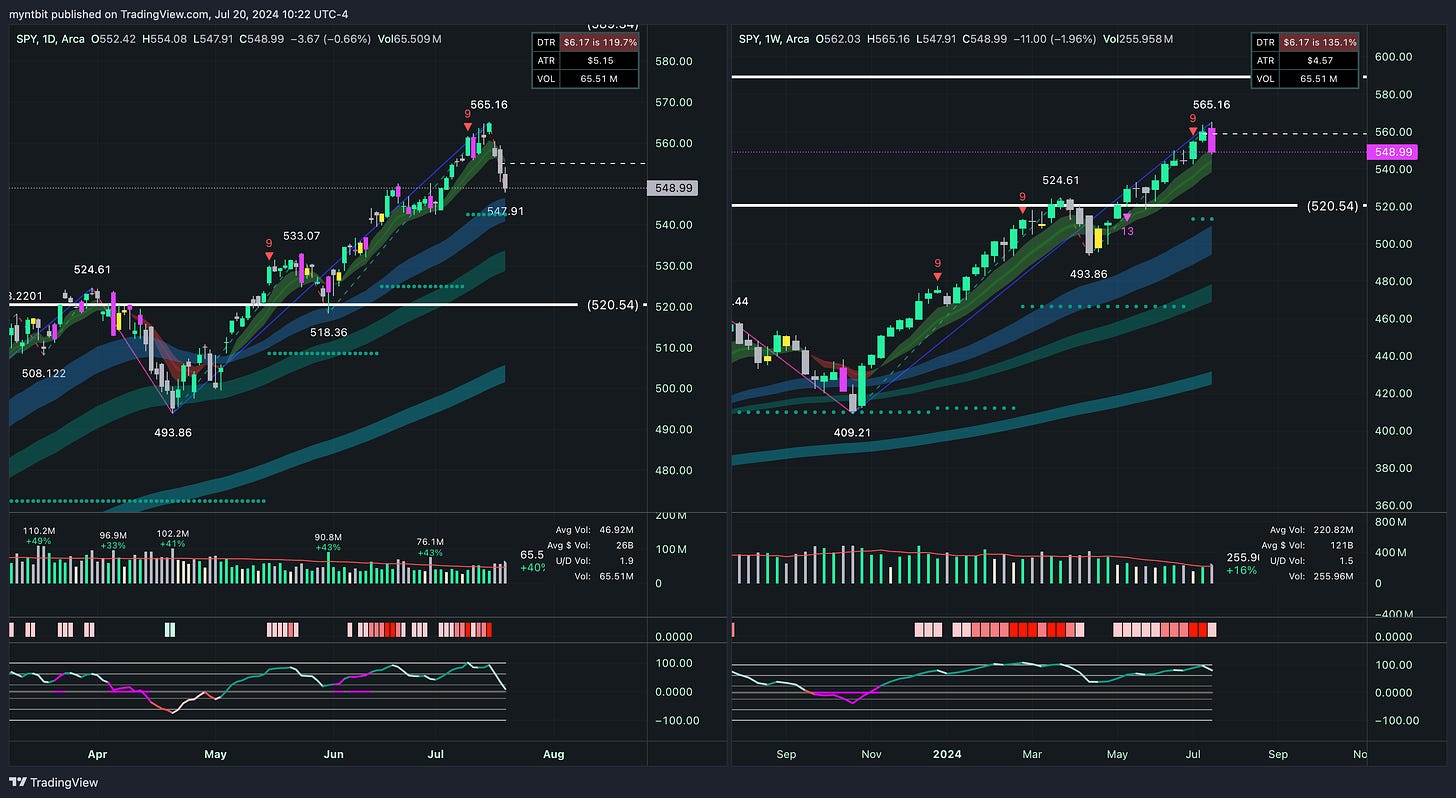
SPY - SPDR S&P 500 ETF Trust
Bullish Case:
If the price manages to reclaim 552.42 and sustain above it, it could indicate further upside towards 565.16, driven by the overall bullish trend.
Bearish Case:
If the price continues to stay below 552.42 and breaks below 542.91, it could signal a pullback towards the support at 520.54.
Trend
Short Term (1-2 weeks): Bearish. The price has broken below key support levels, indicating potential further downside.
Medium Term (1-3 months): Cautious Bullish. The overall trend remains strong, but the recent pullback suggests caution.
Long Term (3+ months): Bullish. The long-term trend is supported by consistent higher highs and higher lows, indicating a sustained bullish outlook.
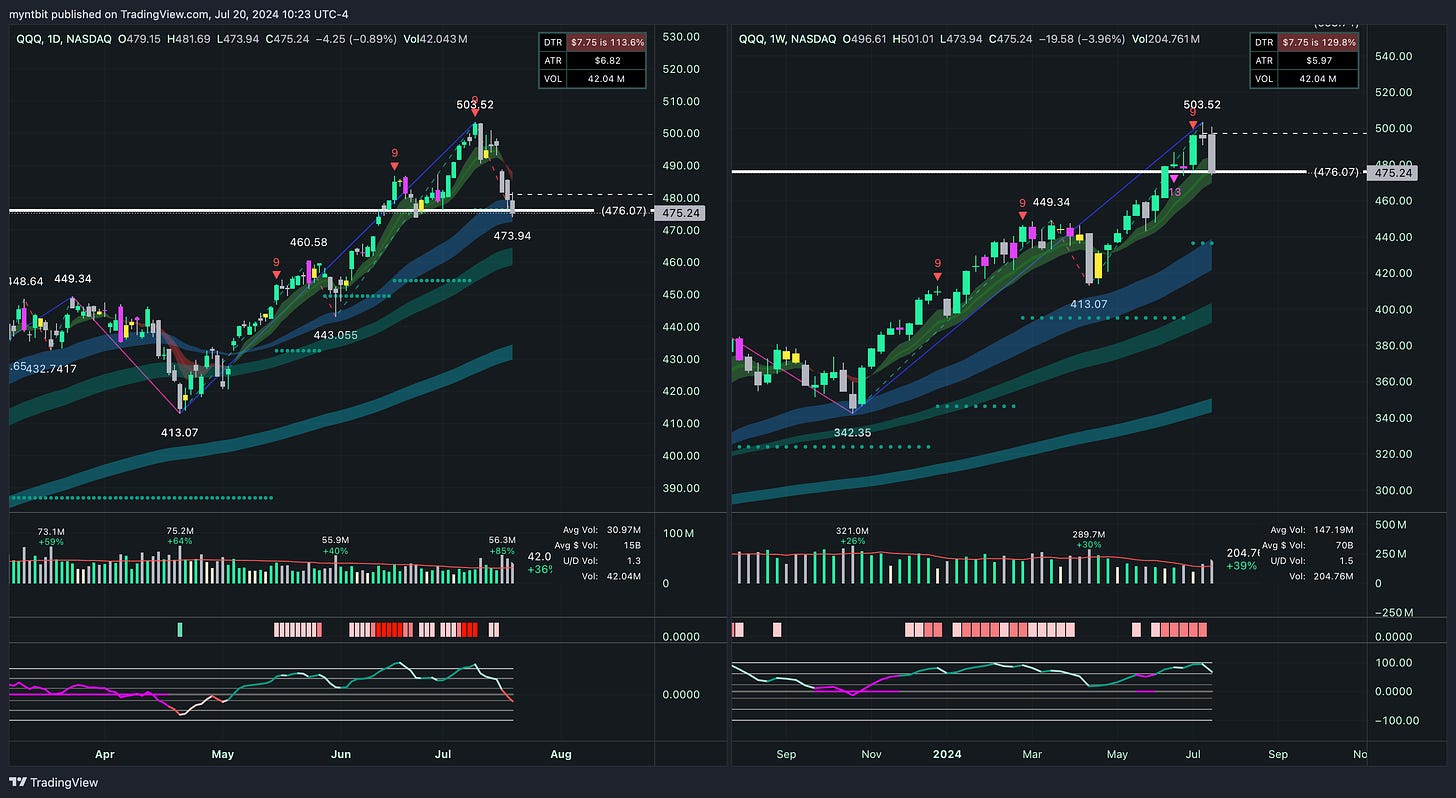
QQQ - Invesco QQQ Trust Series 1
Bullish Case:
If the price manages to reclaim 476.07 and sustain above it, it could indicate further upside towards 503.52, driven by the overall bullish trend.
Bearish Case:
If the price continues to stay below 476.07 and breaks below 473.94, it could signal a pullback towards the support at 460.58.
Trend
Short Term (1-2 weeks): Bearish. The price has broken below key support levels, indicating potential further downside.
Medium Term (1-3 months): Cautious Bullish. The overall trend remains strong, but the recent pullback suggests caution.
Long Term (3+ months): Bullish. The long-term trend is supported by consistent higher highs and higher lows, indicating a sustained bullish outlook.
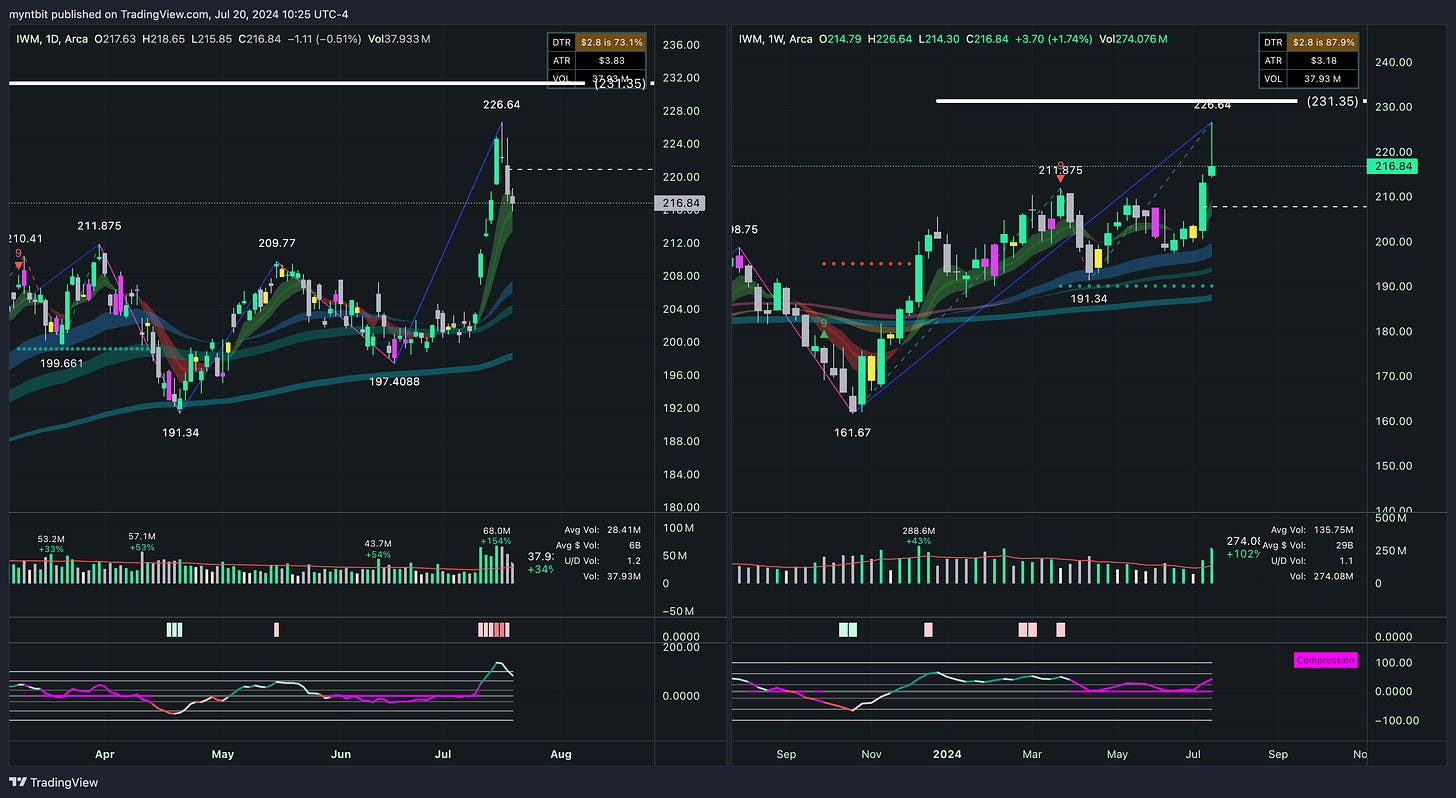
IWM - iShares Russell 2000 ETF
Bullish Case:
If the price manages to reclaim and sustain above 220.00, it could indicate further upside towards 226.64, driven by the overall bullish trend.
Bearish Case:
If the price continues to stay below 220.00 and breaks below 214.30, it could signal a pullback towards the support at 211.875.
Trend
Short Term (1-2 weeks): Neutral to Bullish. The price is in a consolidation phase with potential for a short-term pullback.
Medium Term (1-3 months): Bullish. The overall trend remains strong, supported by higher highs and higher lows.
Long Term (3+ months): Bullish. The long-term trend is supported by consistent higher highs and higher lows, indicating a sustained bullish outlook.
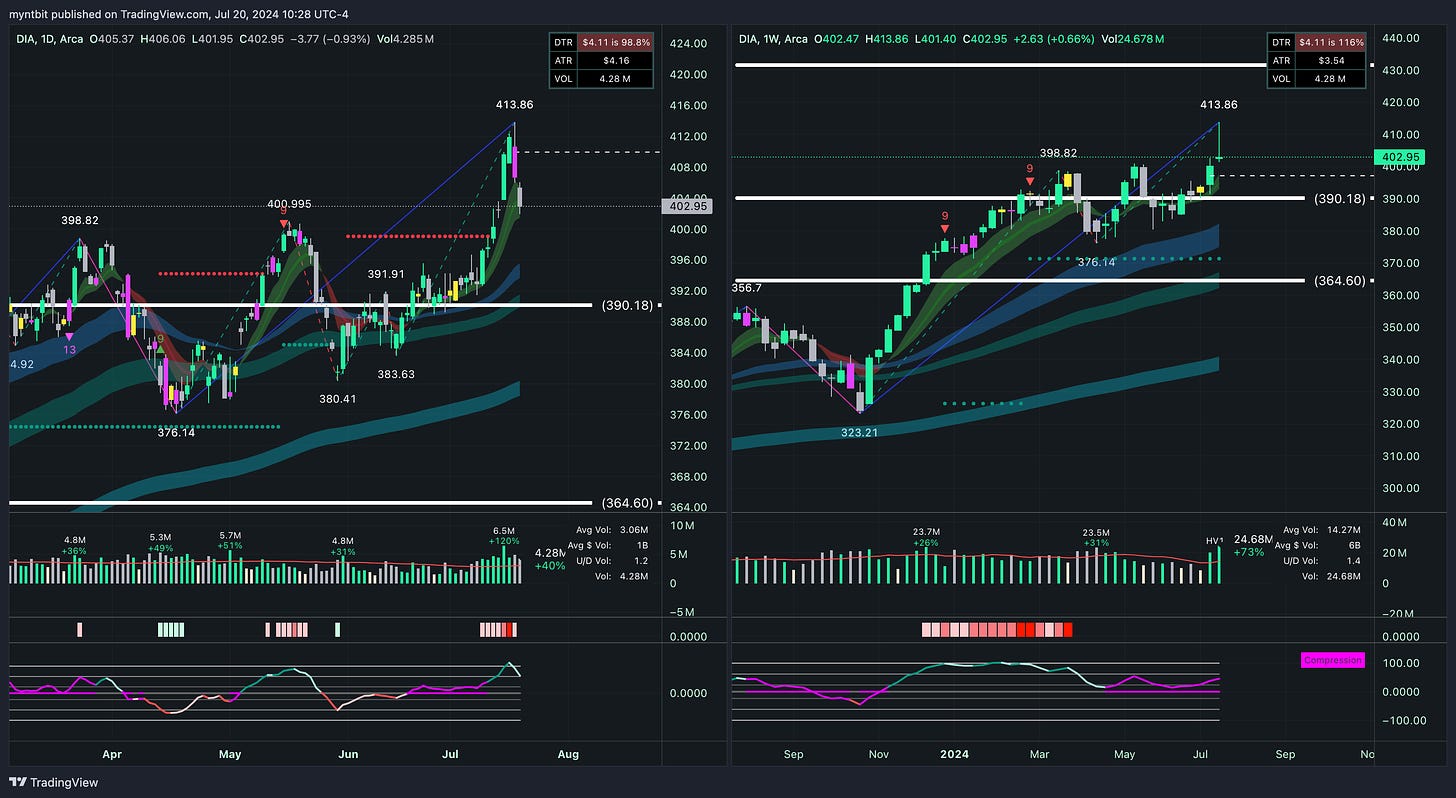
DIA - SPDR Dow Jones Industrial Average ETF Trust
Bullish Case:
If the price manages to reclaim and sustain above 406.00, it could indicate further upside towards 413.86, driven by the overall bullish trend.
Bearish Case:
If the price continues to stay below 406.00 and breaks below 400.00, it could signal a pullback towards the support at 390.18.
Trend
Short Term (1-2 weeks): Neutral to Bullish. The price is in a consolidation phase with potential for a short-term pullback.
Medium Term (1-3 months): Bullish. The overall trend remains strong, supported by higher highs and higher lows.
Long Term (3+ months): Bullish. The long-term trend is supported by consistent higher highs and higher lows, indicating a sustained bullish outlook.
VIX - Volatility S&P 500 Index
Bullish Case:
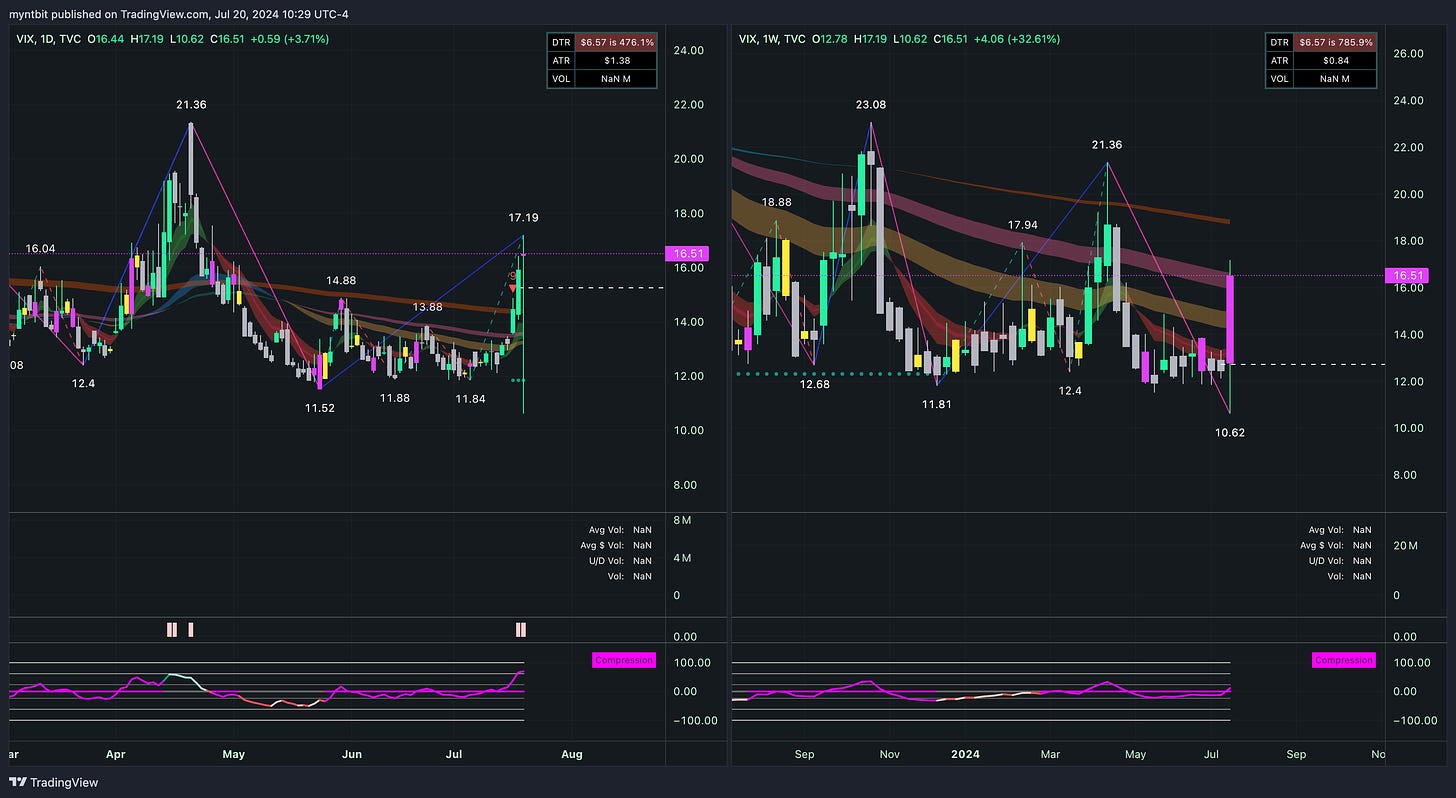
The significant spike in the VIX suggests heightened market fear or uncertainty. If the VIX breaks above 17.19, the next target could be the previous high of 21.36, indicating further market turmoil.
Bearish Case:
If the VIX fails to sustain above 17.19 and falls below 14.00, it could indicate a return to lower volatility, suggesting market stabilization.
Trend
Short Term (1-2 weeks): Bullish. The VIX shows strong upward momentum with significant bullish candlesticks.
Medium Term (1-3 months): Bullish. The recent spike indicates potential continued volatility in the medium term.
Long Term (3+ months): Neutral to Bullish. The long-term trend will depend on whether this spike in volatility is sustained or if it reverts back to lower levels.
Last Week's Watchlist
NVDA - Nvidia Corp
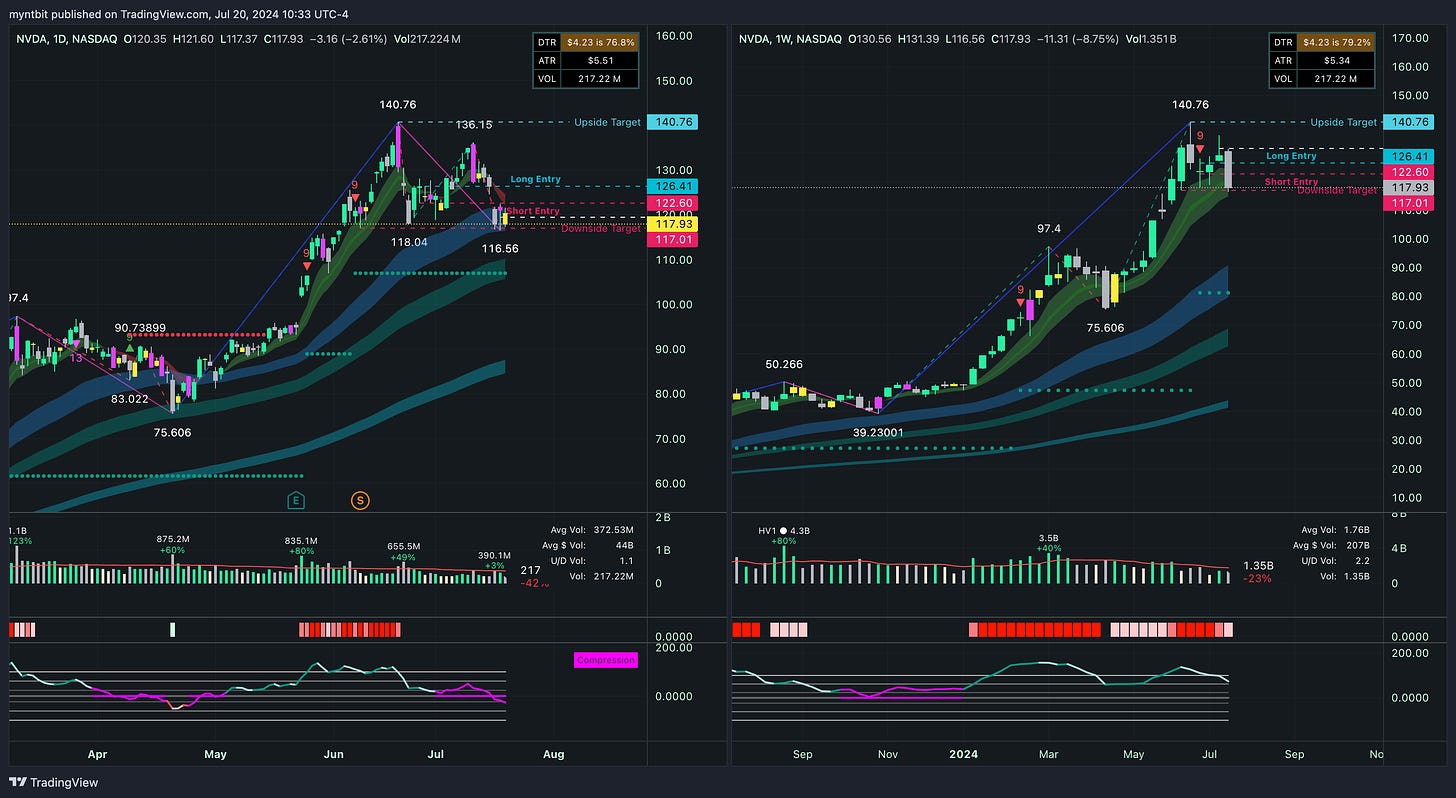
NVDA hit the downside target. Will be removed from the list.
GE - General Electric Co
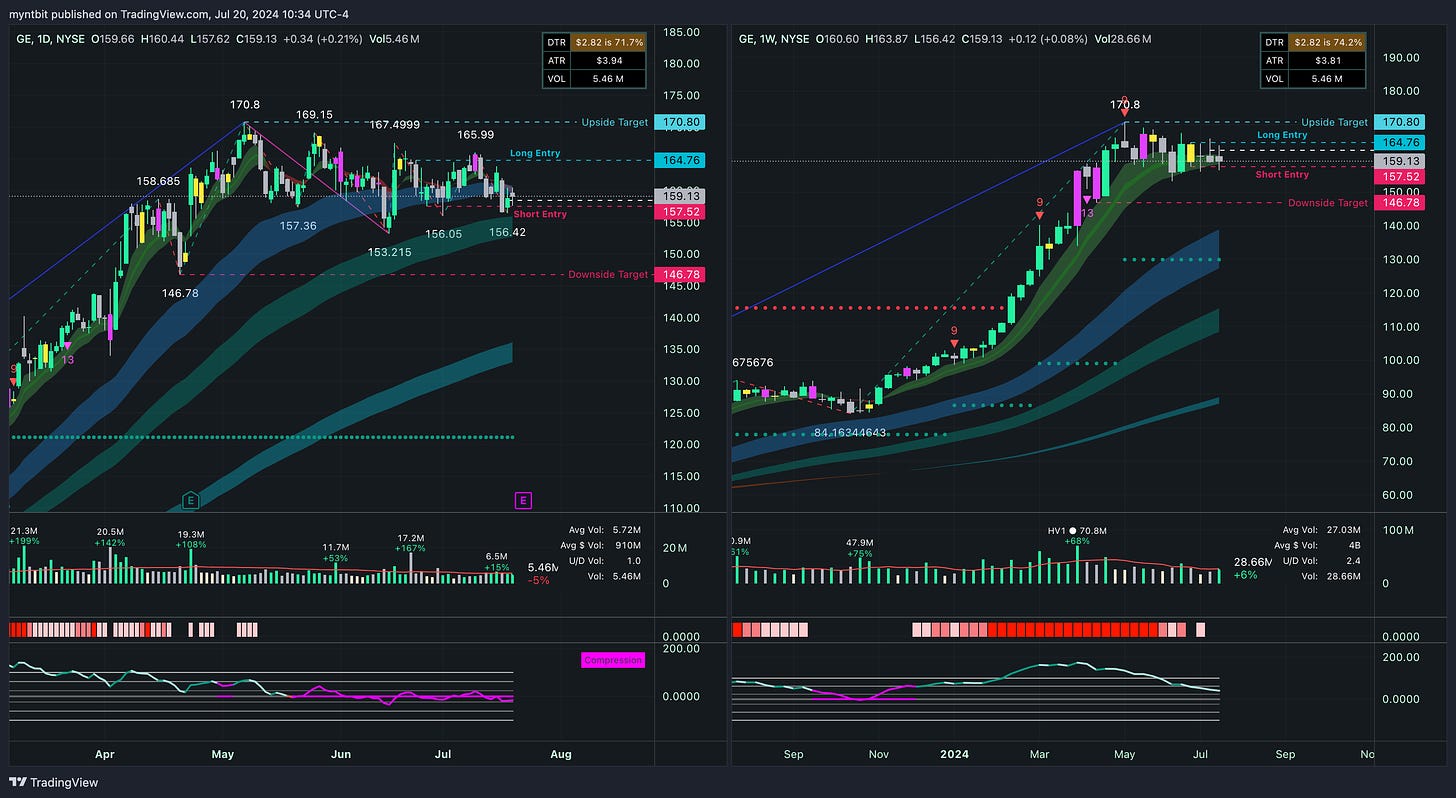
Nothing has changed with GE as it’s still consolidating. The targets remain the same.
Bullish Case:
If the price breaks above the resistance level of 164.76 on the daily chart, there is potential for a move towards 170.80 and higher.
A sustained move above 170.80 on the weekly chart could indicate a more significant upward trend.
Bearish Case:
The price is currently below key moving averages, suggesting a bearish trend.
The downside targets are at 157.52 and 146.78, which could be tested if the price fails to break above resistance levels.
CVNA - Carvana Co.
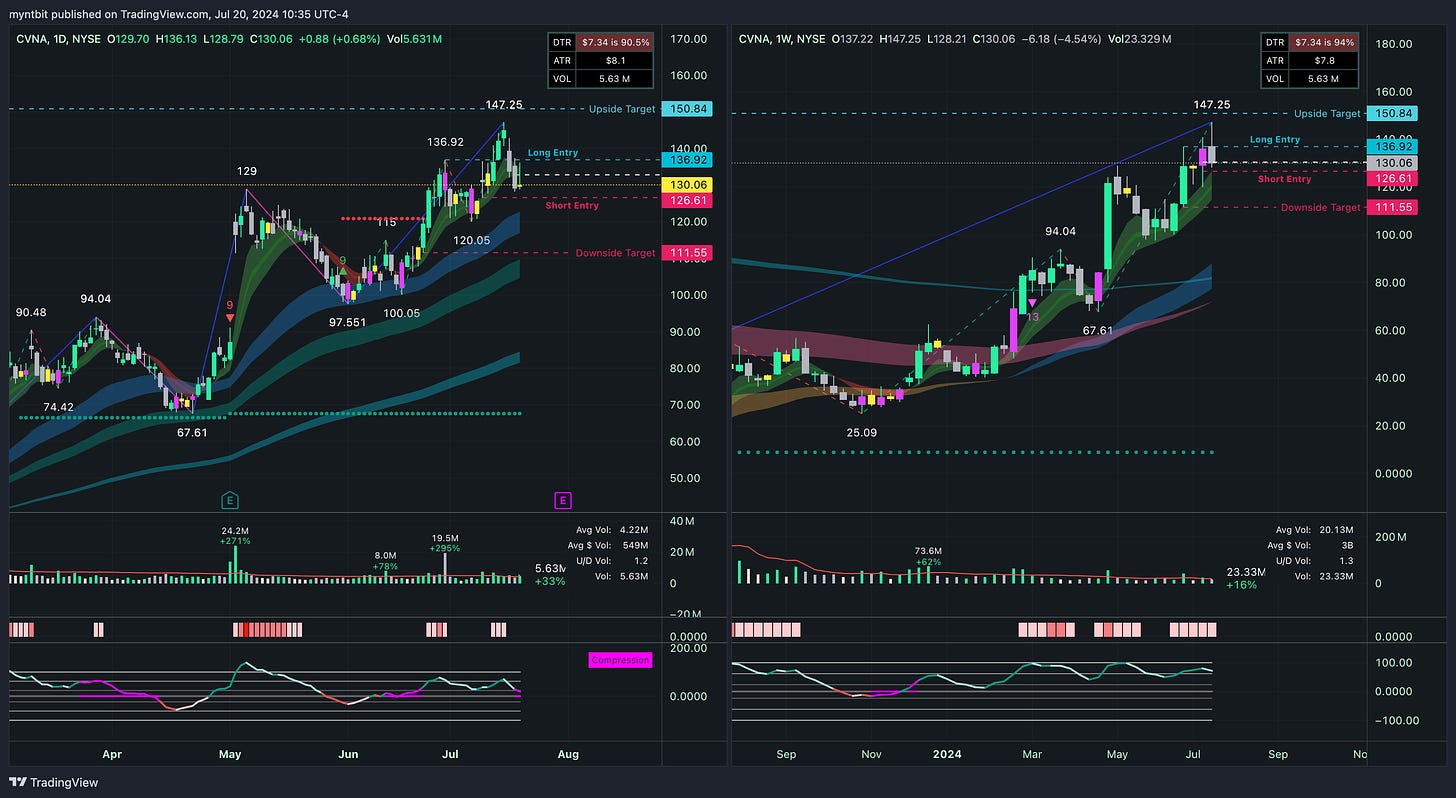
Caution on CVNA, a it broke above Long Entry but rejected all the way back down. The targets remain the same.
Bullish Case:
The price breaking and sustaining above 140.91 could indicate further upside towards 150.84, driven by strong momentum and volume.
Bearish Case:
If the price fails to sustain above 140.91 and breaks below 130.00, it could signal a pullback towards the support at 120.00.
CRWD - CrowdStrike Holdings, Inc.
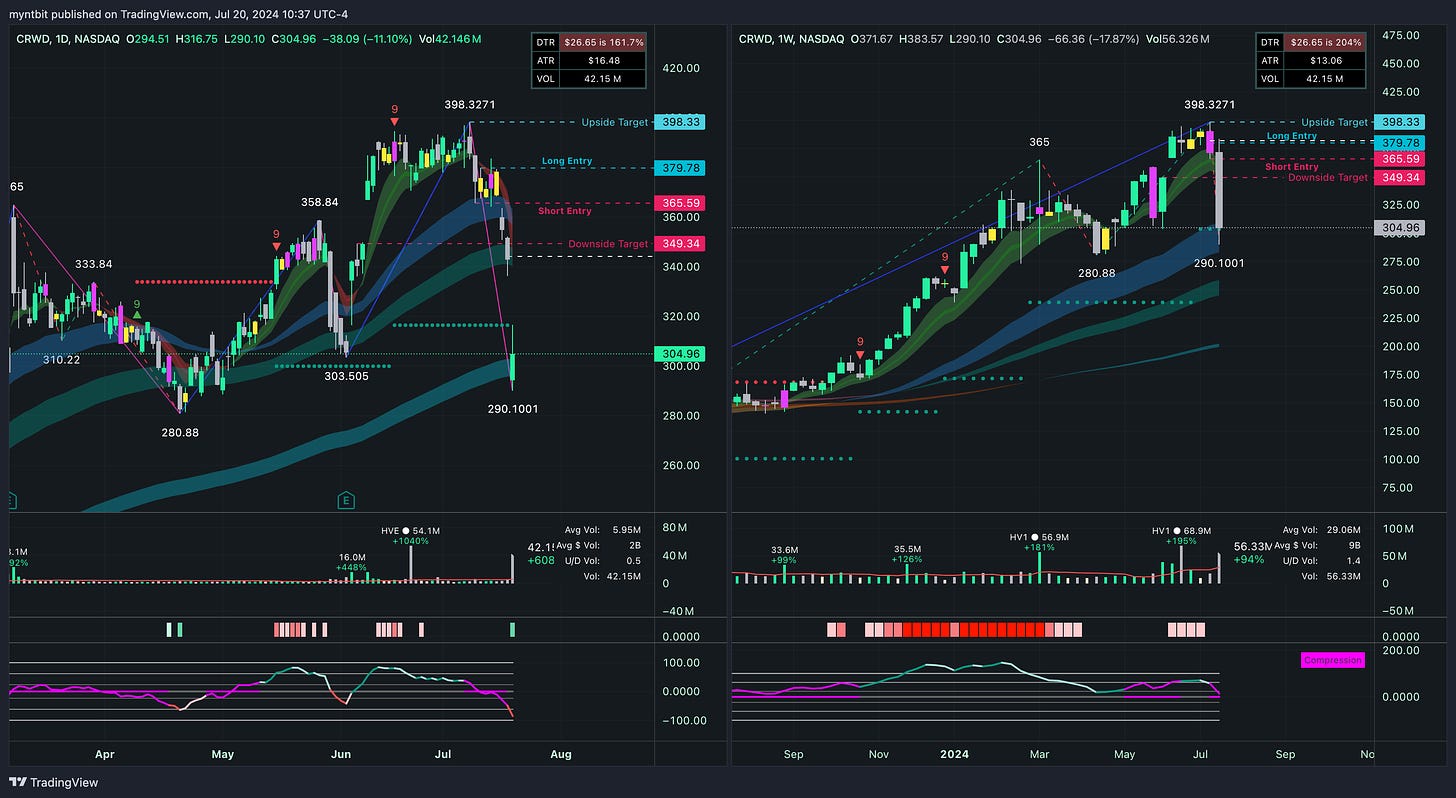
CRWD hit the downside target. Will be removed from the list.
MU - Micron Technology, Inc.
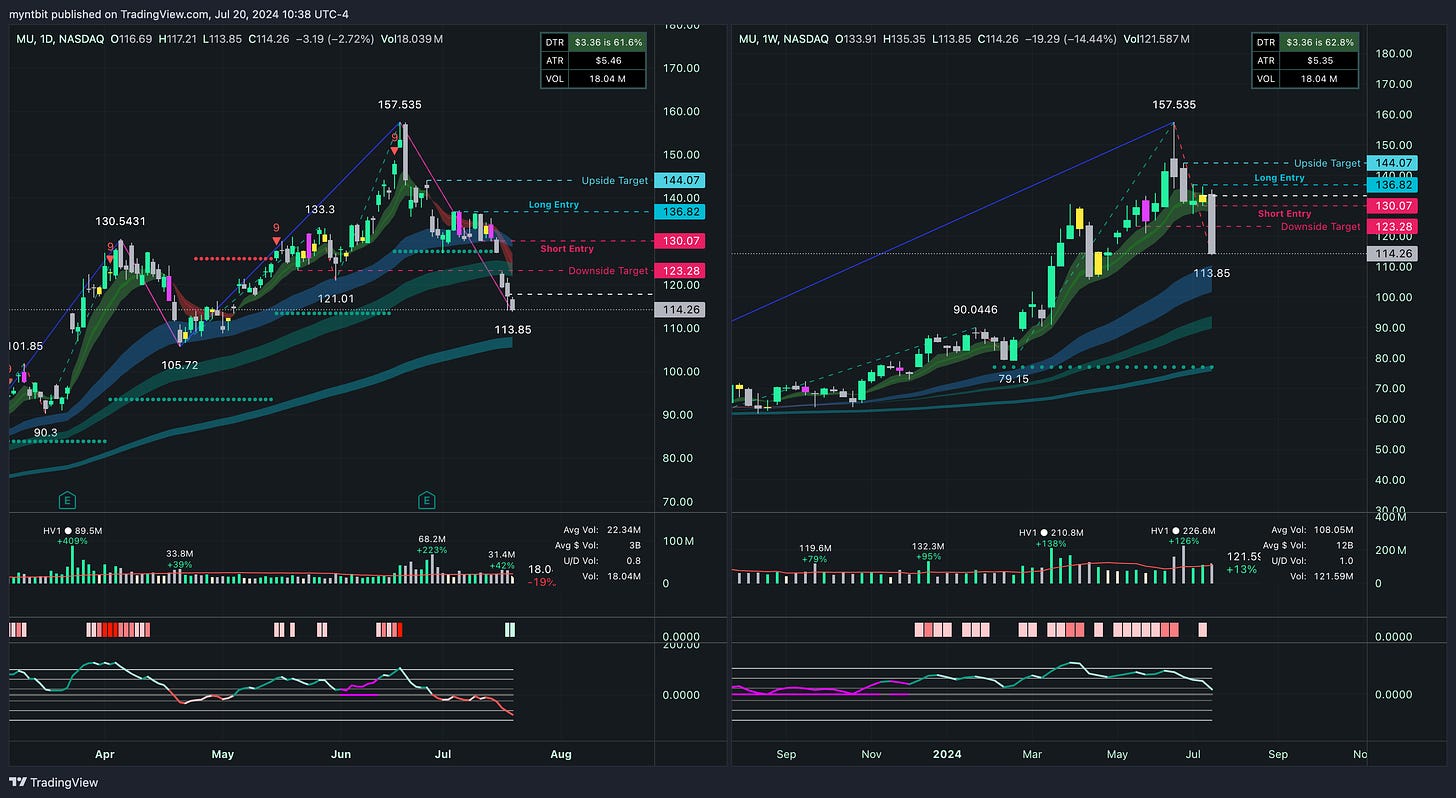
MU hit the downside target. Will be removed from the list.
Stock Watchlist for the Upcoming Week
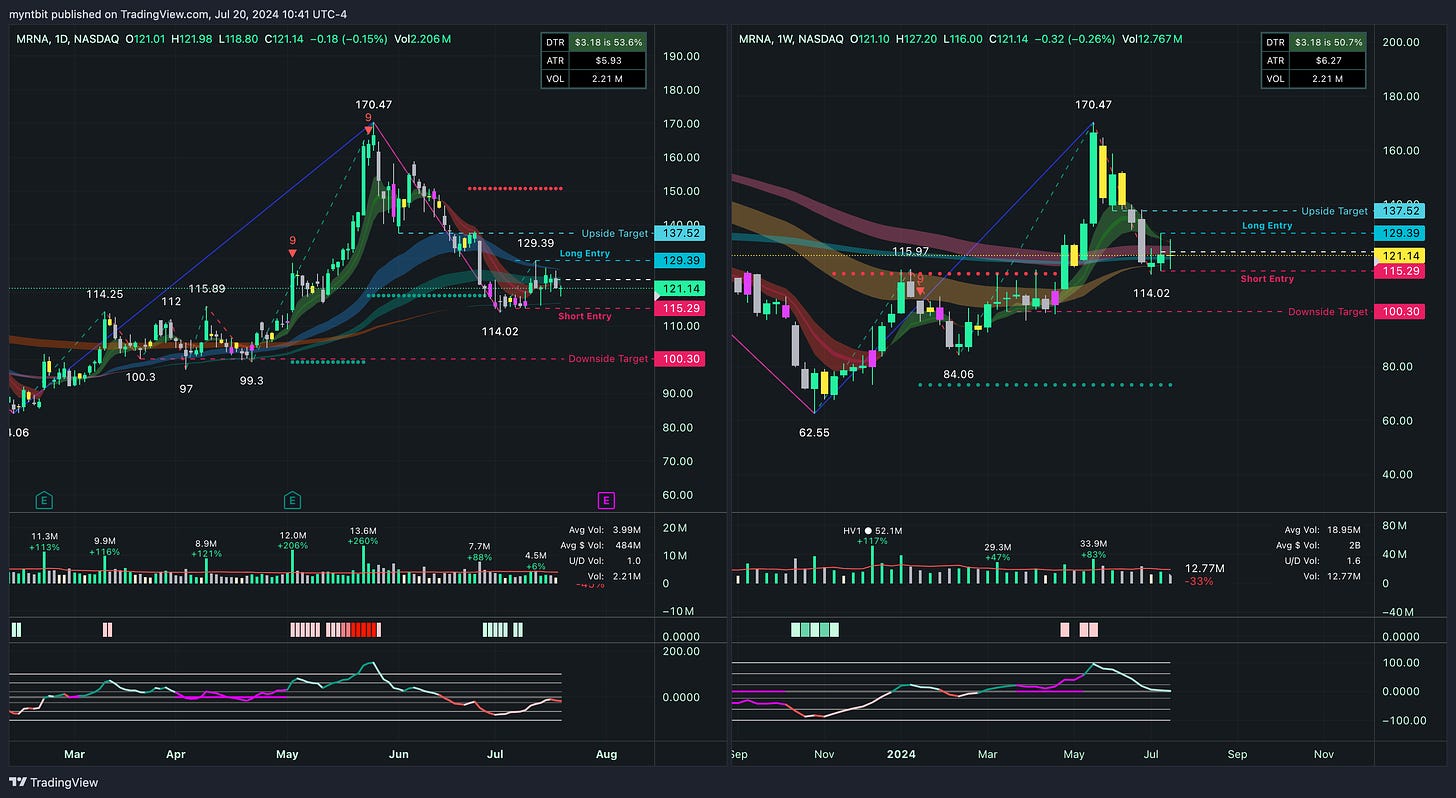
MRNA - Moderna, Inc. (Freebie)
Bullish Case:
A break above the 129.39 resistance level could push the stock towards the next target at 137.52. The consolidation phase might be a precursor to a bullish breakout if supported by increased volume.
Bearish Case:
A failure to hold the 114.02 support level could lead to a decline towards the next support at 100.30, indicating a continuation of the downtrend.
Options Opportunity
Call Option: Consider buying a call option with a strike price around 130.00, expiring in the next 1-2 months, to capitalize on a potential breakout above the resistance.
Put Option: Alternatively, a put option with a strike price around 115.00, expiring in 1-2 months, could be considered if the stock fails to break above the resistance and continues to decline.


