Weekly Report | Jul 14, 2024 + CVNA, CRWD, MU
What is included in this week's edition?
WEEKLY REVIEW: An overview of current market standing, fundamental matters with implications upon the market, and general sentiment regarding the major US indices.
LOOKING AHEAD: Key takeaways to consider as we look forward to the upcoming trading week.
MARKETS: A technical review of the major indices and commodities that represent the overall health of the market.
Market Trader by MyntBit | Issue# 26
Stocks rose over the week as Consumer Price Index (CPI) inflation came in below consensus expectations, showing a slower pace compared to the prior month across all measures. This supported expectations for rate cuts in 2024. Meanwhile, Producer Price Index (PPI) inflation exceeded consensus expectations and increased compared to the previous month, but it had little impact on market sentiment. The University of Michigan’s preliminary Consumer Sentiment Index for July and consumer credit both indicated a challenged consumer. Despite slight improvement, the National Federation of Independent Business’s (NFIB’s) small business optimism still pointed to a restrictive environment. Additionally, several Federal Reserve (Fed) speakers acknowledged the encouraging impact of the CPI data while emphasizing the need for further information.
Looking ahead to next week, investors will focus on a series of data updates. Key releases will include retail sales, housing-market data (including housing starts, building permits, and the National Association of Home Builders Housing Market Index), the Leading Economic Index, and business-related updates such as industrial production and capacity utilization.
Weekly Market Review
The stock market posted gains overall, but the first half of the week lacked strong conviction ahead of key economic events. The June Consumer Price Index (CPI) and Producer Price Index (PPI) were released on Thursday and Friday, respectively.
The total CPI decreased by 0.1% month-over-month, slowing the year-over-year growth rate to 3.0% from 3.3% in May. The core CPI, which excludes food and energy, decelerated to 3.3% year-over-year from 3.4%. Meanwhile, the total PPI rose by 0.2%, surpassing the expected 0.1% increase, and the core PPI increased by 0.4%, above the anticipated 0.1%.
The CPI report overshadowed the PPI report, boosting optimism about the inflation trajectory and Fed policy. The fed funds futures market now shows a 94.4% probability of a rate cut at the September FOMC meeting, up from 77.7% a week ago. Treasury yields fell in response to the data, supporting equities, with the 10-year note yield dropping eight basis points to 4.19% and the 2-year note yield declining 14 basis points to 4.46%.
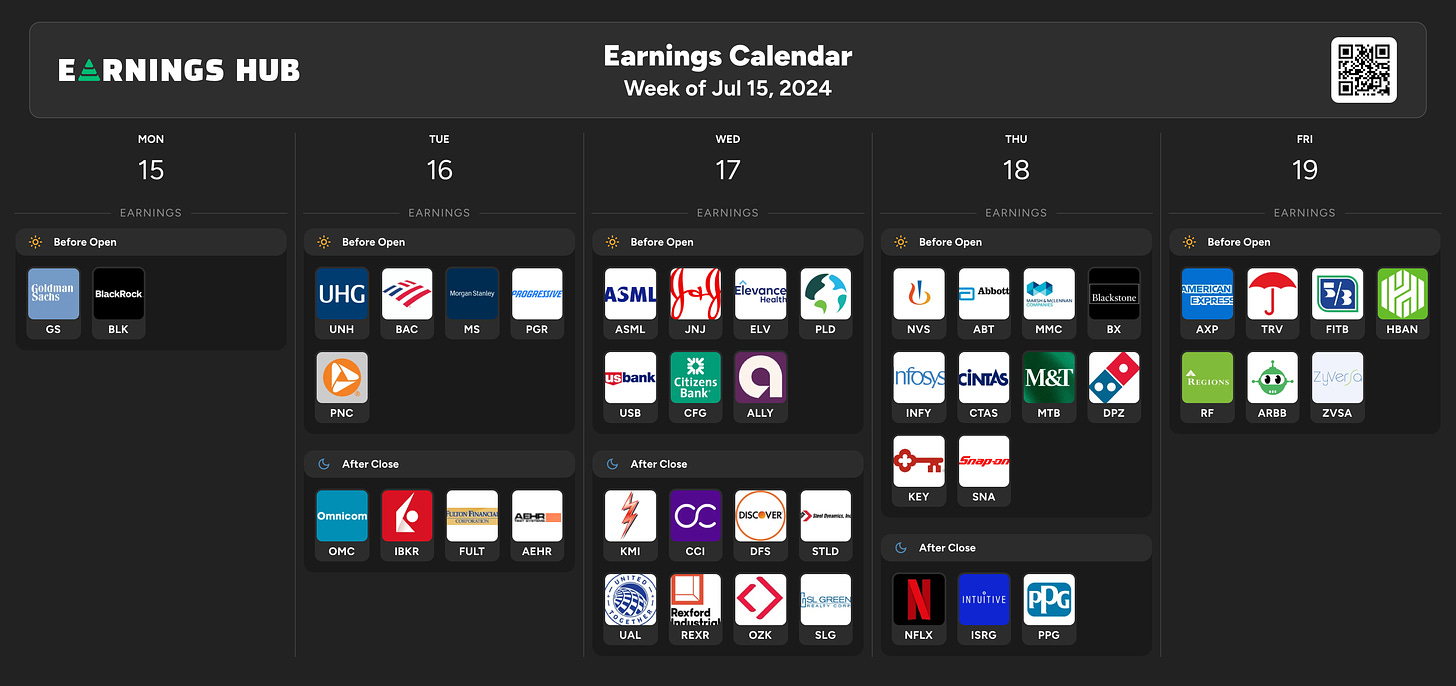
This week's calendar also marked the start of earnings season, with JPMorgan Chase (JPM), Wells Fargo (WFC), and Citigroup (C) reporting results before Friday's opening. Despite beating earnings estimates, their quarterly results received negative responses. Fed Chair Powell's semiannual monetary policy testimony before the Senate Banking Committee and the House Financial Services Committee did not significantly impact bond or equity markets, as his remarks contained no surprises and suggested that a rate hike is unlikely.
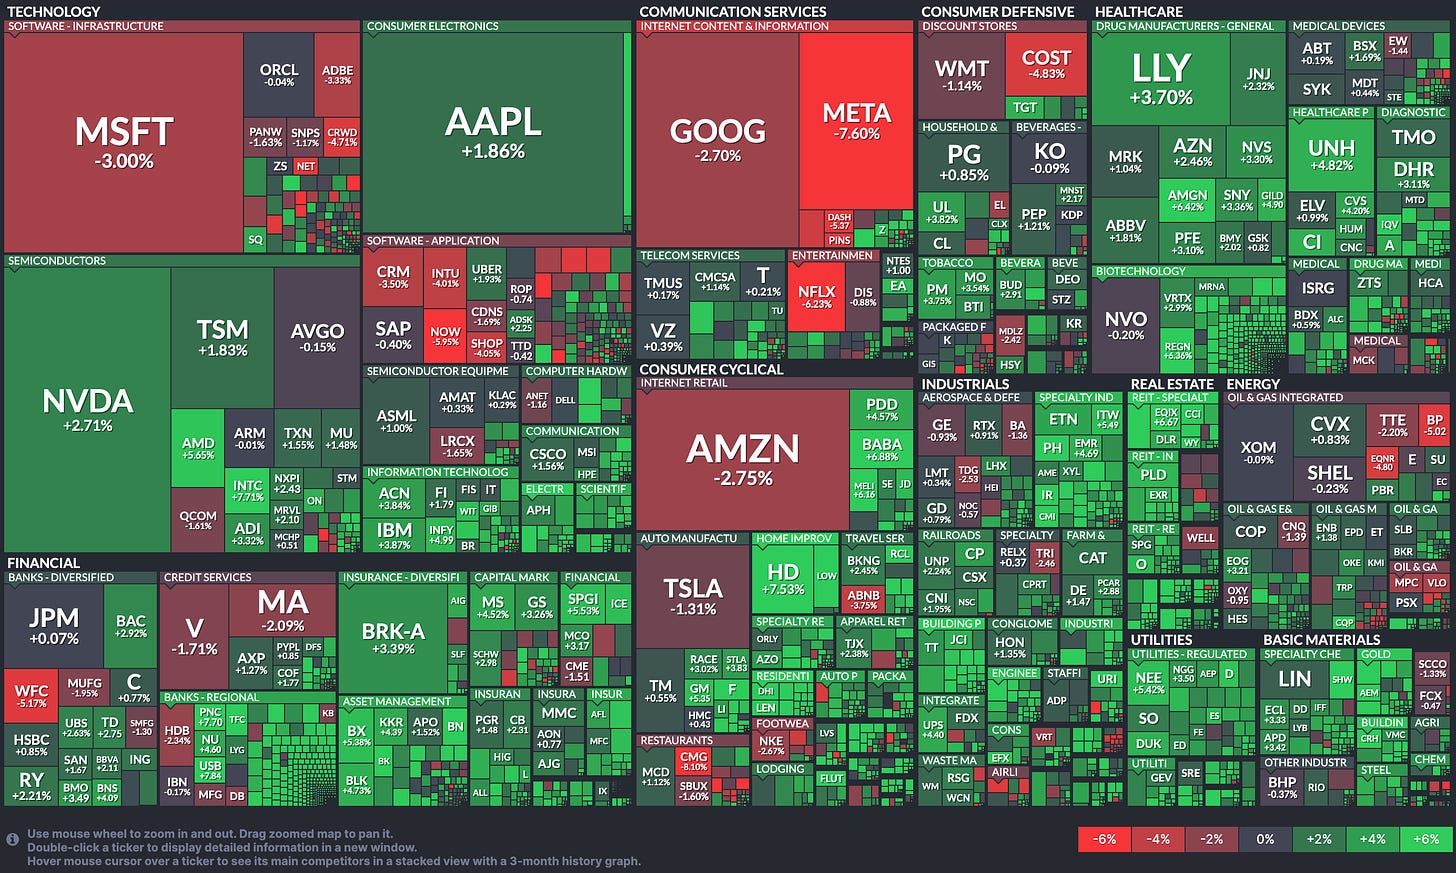
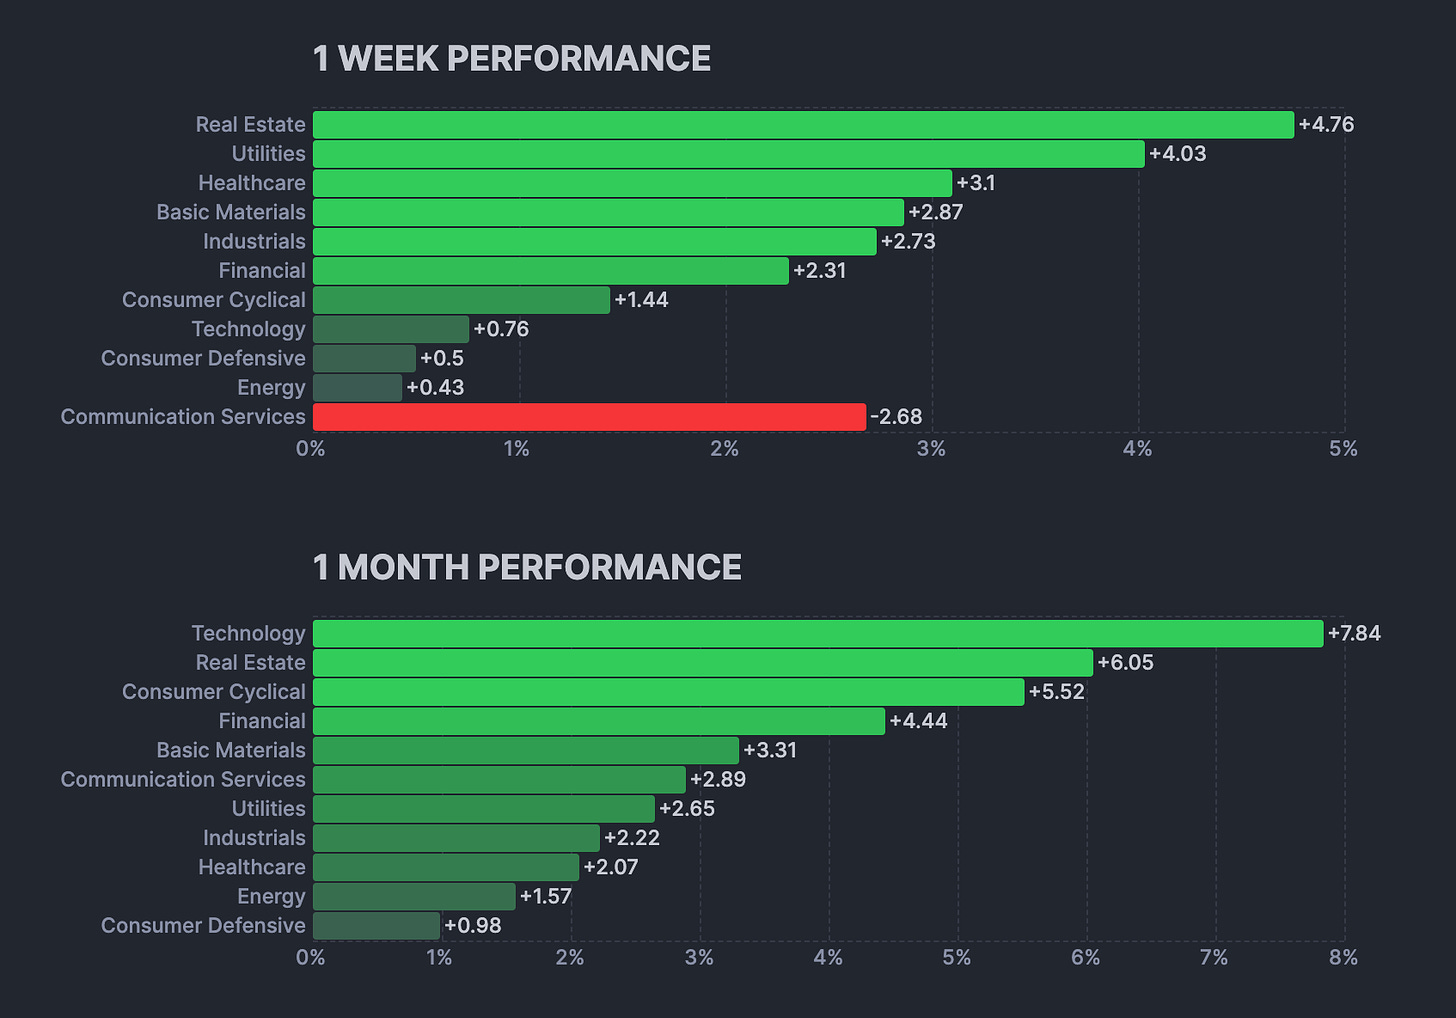
Losses in mega-cap stocks limited gains for the S&P 500 and Nasdaq Composite. The Vanguard Mega Cap Growth ETF (MGK) recorded a 0.7% decline as money rotated away from mega caps due to profit-taking and into market areas that have lagged this year. The Russell 2000 surged 6.0%, and the S&P Mid Cap 400 gained 4.3%. The Invesco S&P 500 Equal Weight ETF (RSP) posted a 3.0% gain. The top-performing S&P 500 sectors were the rate-sensitive real estate (+4.4%) and utilities (+3.9%), along with materials (+3.0%) and industrials (+2.4%).
Year-to-date performance:
Nasdaq Composite: +22.6%
S&P 500: +17.7%
S&P Midcap 400: +8.6%
Dow Jones Industrial Average: +6.1%
Russell 2000: +6.0%
Weekly Performance Heatmap
Overall Stock Market Heatmap & Sector Performance
Looking Ahead to the Upcoming Week
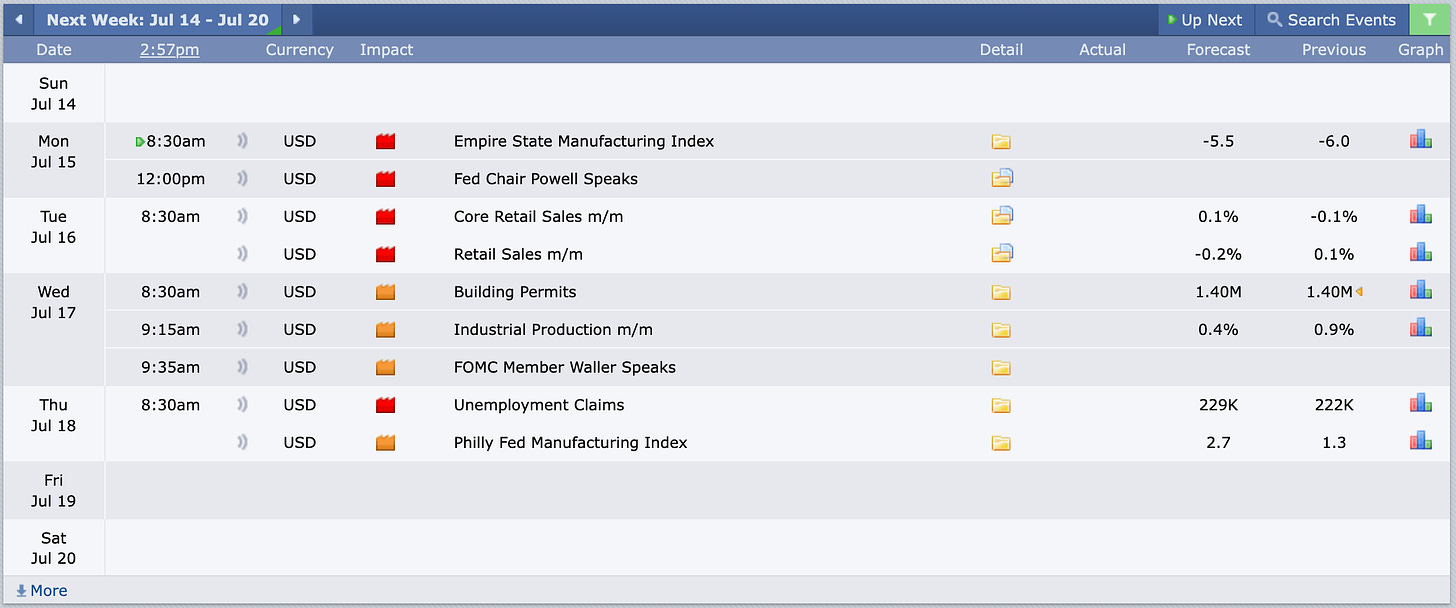
The highlights of the week will include updates on retail sales and industrial production, as well as the Fed’s Beige Book survey of regional economic conditions. Other reports drawing attention will be the Index of Leading Economic Indicators, the Import Price Index, business inventories, and regional business surveys from the New York and Philadelphia Fed districts. Additionally, a range of housing market data, including building permits, housing starts, and homebuilder sentiment, will be released.
In the central bank sphere, Fed Chair Jerome Powell will be interviewed at the Economic Club of Washington DC. The Republican National Convention is also on the agenda. In the auction space, the U.S. Treasury Department will issue $32 billion in 10-year Treasury Inflation-Protected Securities (TIPS) and 20-year bonds.
Internationally, China will focus on a full calendar including second-quarter GDP, industrial production, retail sales, and fixed asset investment, as well as the one-year medium-term lending facility rate and volume from the People’s Bank of China. Additionally, attention will be on China’s Third Plenum policy meeting, which typically occurs every five years. From Japan, updates are expected on the national CPI, Tertiary Industry Index, and trade balance. Australia will release labor market data and its leading index. In Europe, the spotlight will be on the European Central Bank (ECB) policy meeting on Thursday, along with the eurozone’s finalized June CPI, July’s ZEW economic growth expectations, and May’s industrial production and trade balance. Germany will provide updates on the PPI, retail sales, and the ZEW index of current conditions. The U.K. will release labor market data, CPI, a companion Retail Price Index, retail sales, consumer confidence, and house prices.
Important Economic & Earnings Event
Markets
Below are the levels for the upcoming week - updates will be provided on X (previously Twitter) throughout the week.
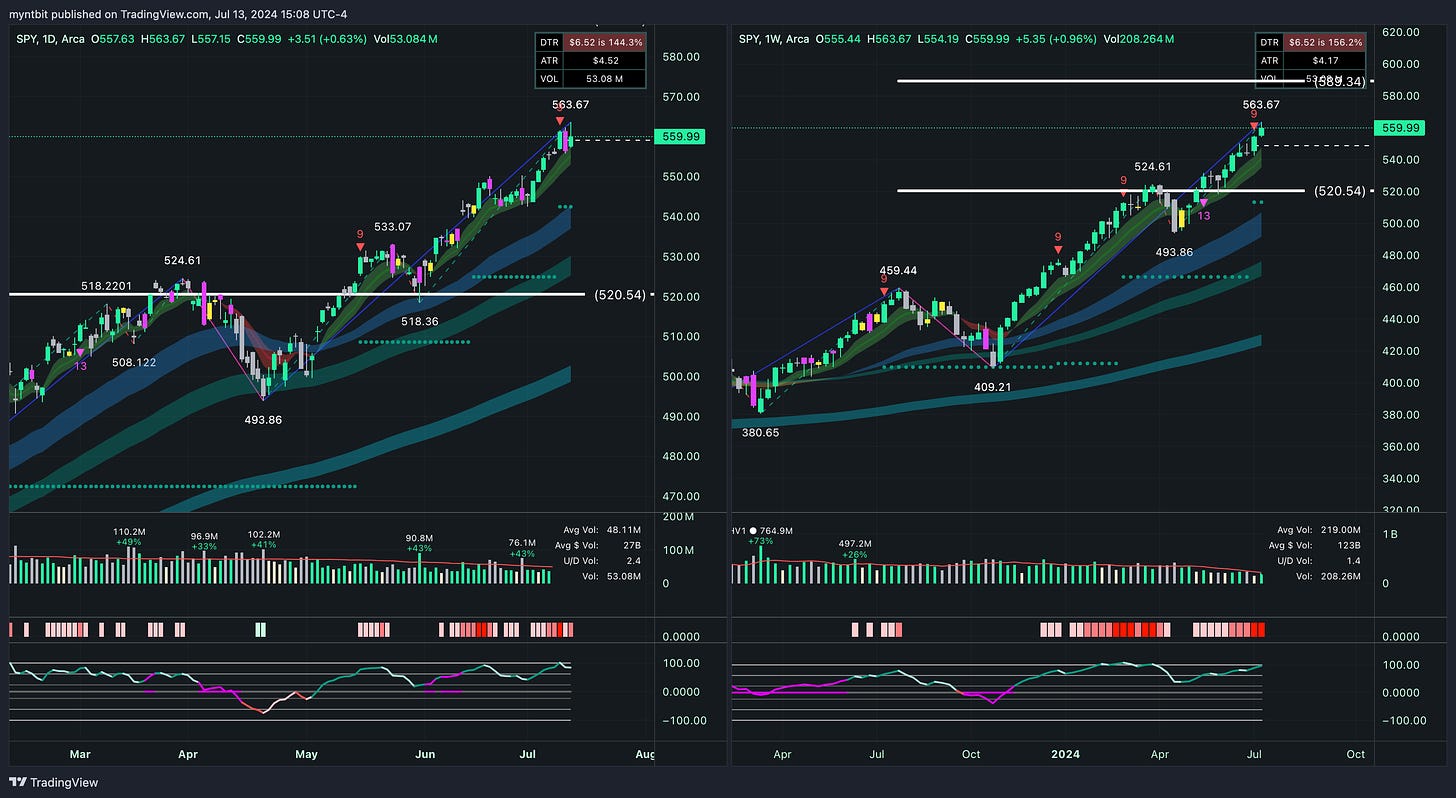
SPY - SPDR S&P 500 ETF Trust
Short Term (1-2 weeks): Neutral to Bullish. The stock might continue to test the recent peak at 563.67. A sustained break above this level would confirm the bullish momentum.
Medium Term (1-3 months): Bullish. The overall trend remains strong, and as long as the price stays above key support levels, the bullish outlook is intact.
Long Term (3+ months): Bullish. The long-term trend remains positive, with the stock making higher highs and higher lows consistently.
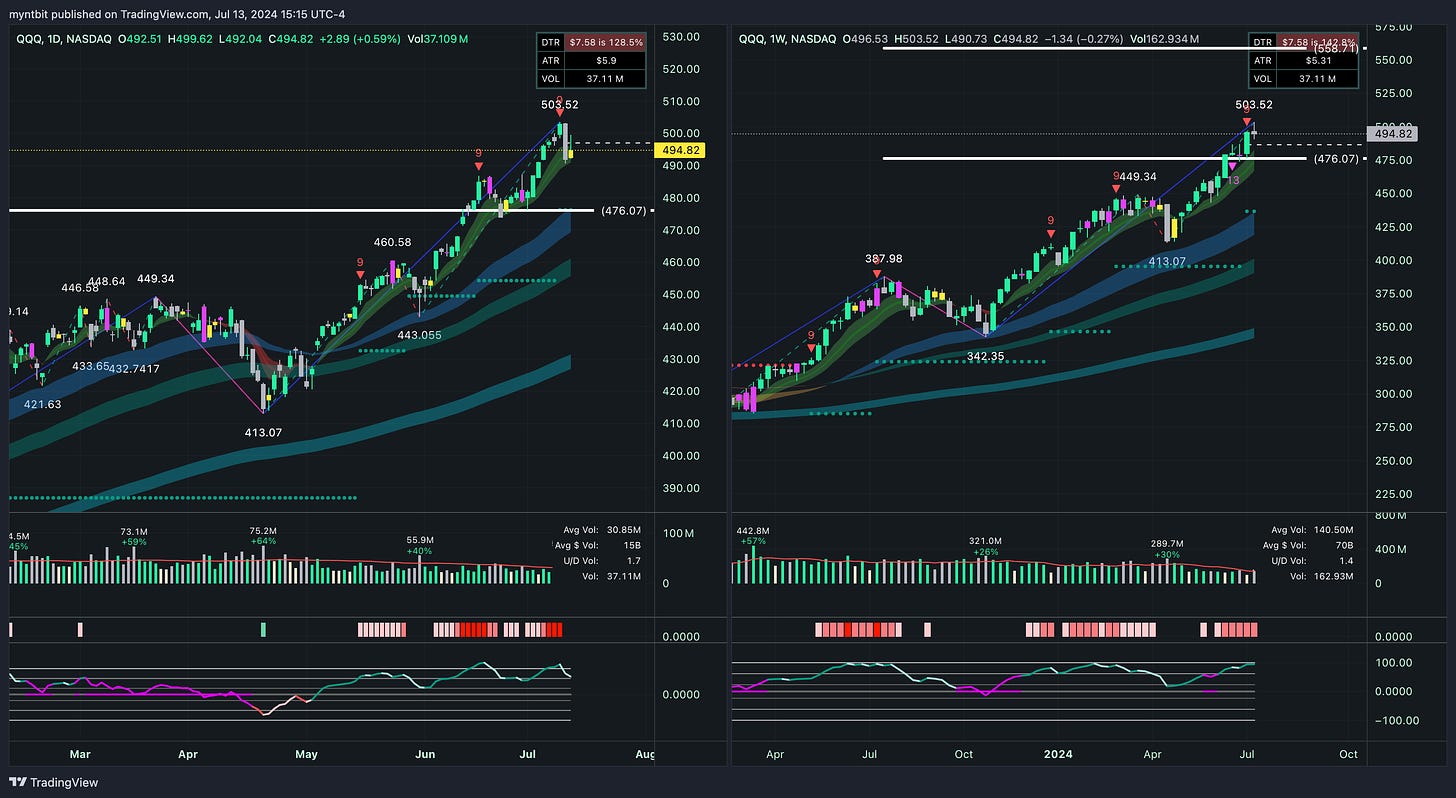
QQQ - Invesco QQQ Trust Series 1
Short Term (1-2 weeks): Neutral to Bullish. The stock might continue to test the recent peak at 503.52. A sustained break above this level would confirm the bullish momentum.
Medium Term (1-3 months): Bullish. The overall trend remains strong, and as long as the price stays above key support levels, the bullish outlook is intact.
Long Term (3+ months): Bullish. The long-term trend remains positive, with the stock making higher highs and higher lows consistently.
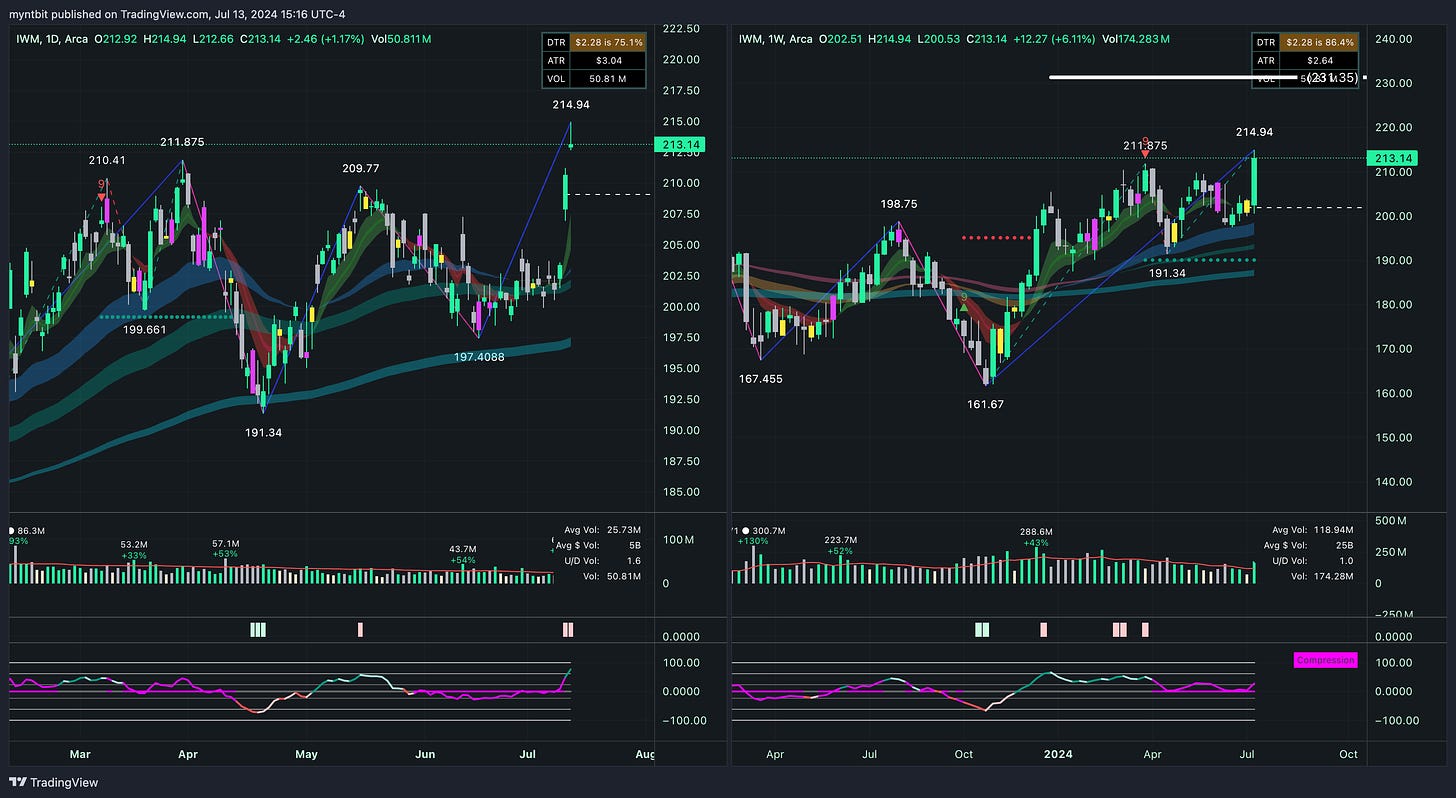
IWM - iShares Russell 2000 ETF
Short Term (1-2 weeks): Bullish. The stock might continue to test the recent peak at 214.94. A sustained break above this level would confirm the bullish momentum.
Medium Term (1-3 months): Bullish. The overall trend remains strong, and as long as the price stays above key support levels, the bullish outlook is intact.
Long Term (3+ months): Bullish. The long-term trend remains positive, with the stock making higher highs and higher lows consistently.
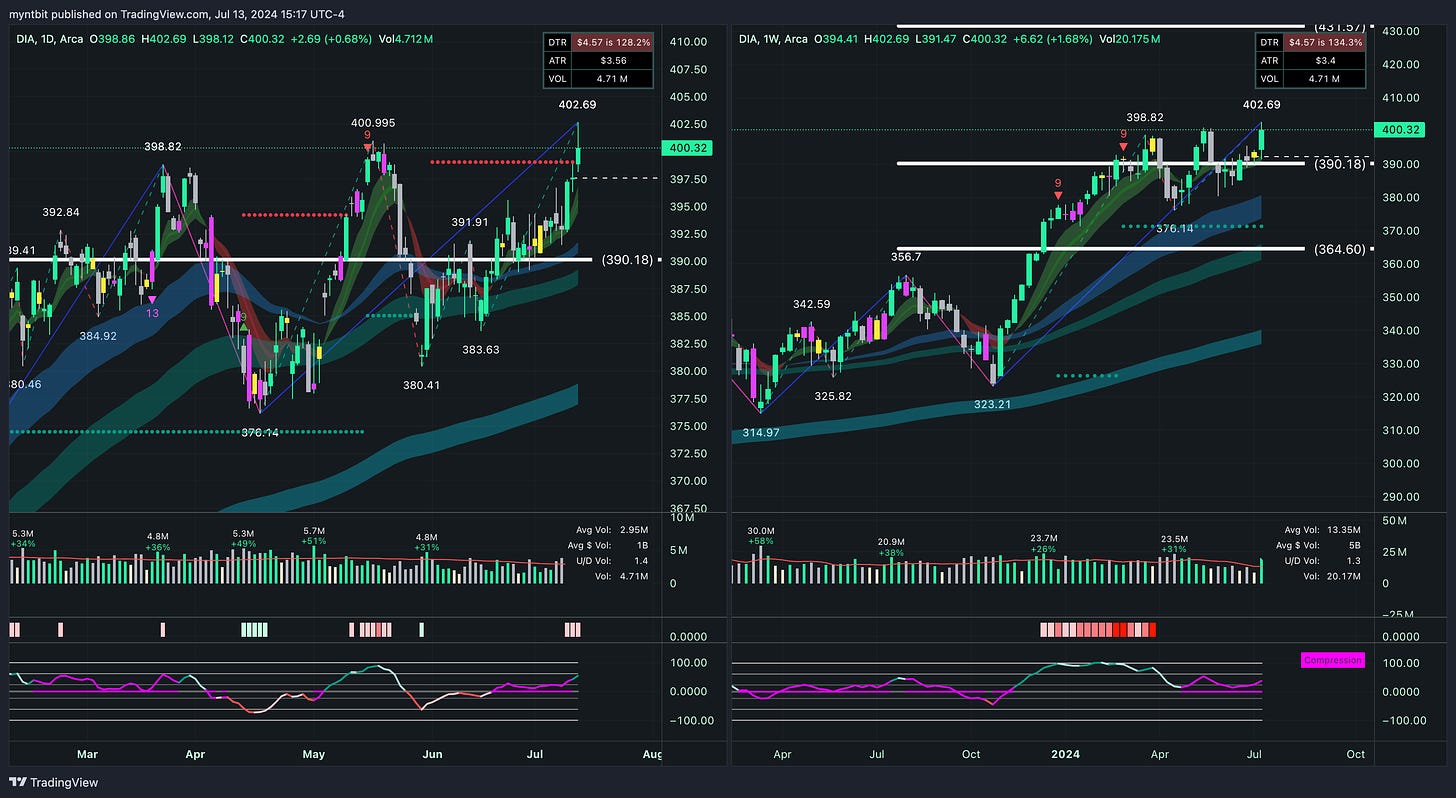
DIA - SPDR Dow Jones Industrial Average ETF Trust
Short Term (1-2 weeks): Bullish. The stock might continue to test the recent peak at 402.69. A sustained break above this level would confirm the bullish momentum.
Medium Term (1-3 months): Bullish. The overall trend remains strong, and as long as the price stays above key support levels, the bullish outlook is intact.
Long Term (3+ months): Bullish. The long-term trend remains positive, with the stock making higher highs and higher lows consistently.
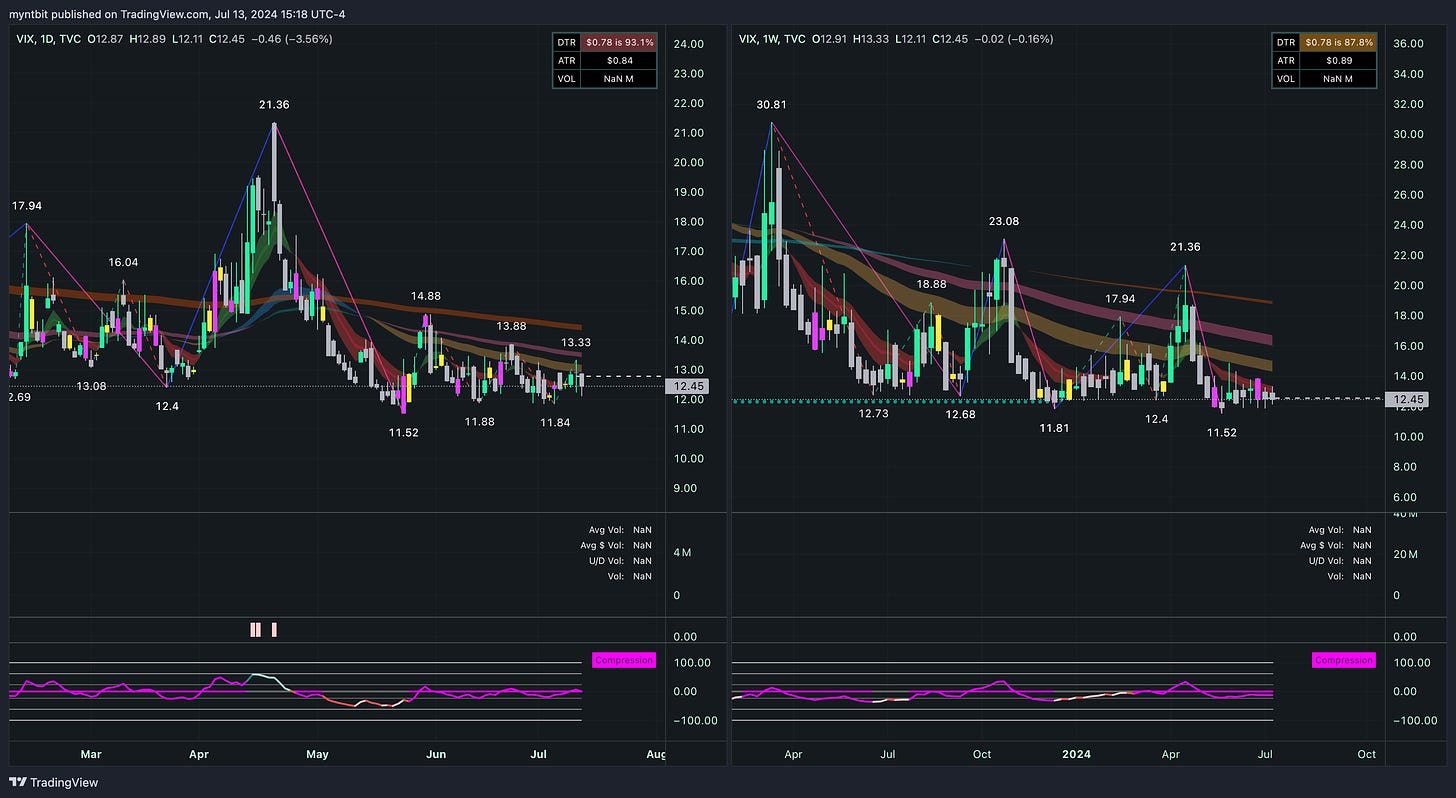
VIX - Volatility S&P 500 Index
Short Term (1-2 weeks): Bearish. The VIX is showing a consistent downward trend with weakening momentum, suggesting further downside potential unless there is a significant reversal.
Medium Term (1-3 months): Bearish. The overall trend remains downward, and as long as the price stays below key resistance levels, the bearish outlook is intact.
Long Term (3+ months): Bearish. The long-term trend remains negative, with consistently lower highs and lower lows.
Last Week's Watchlist
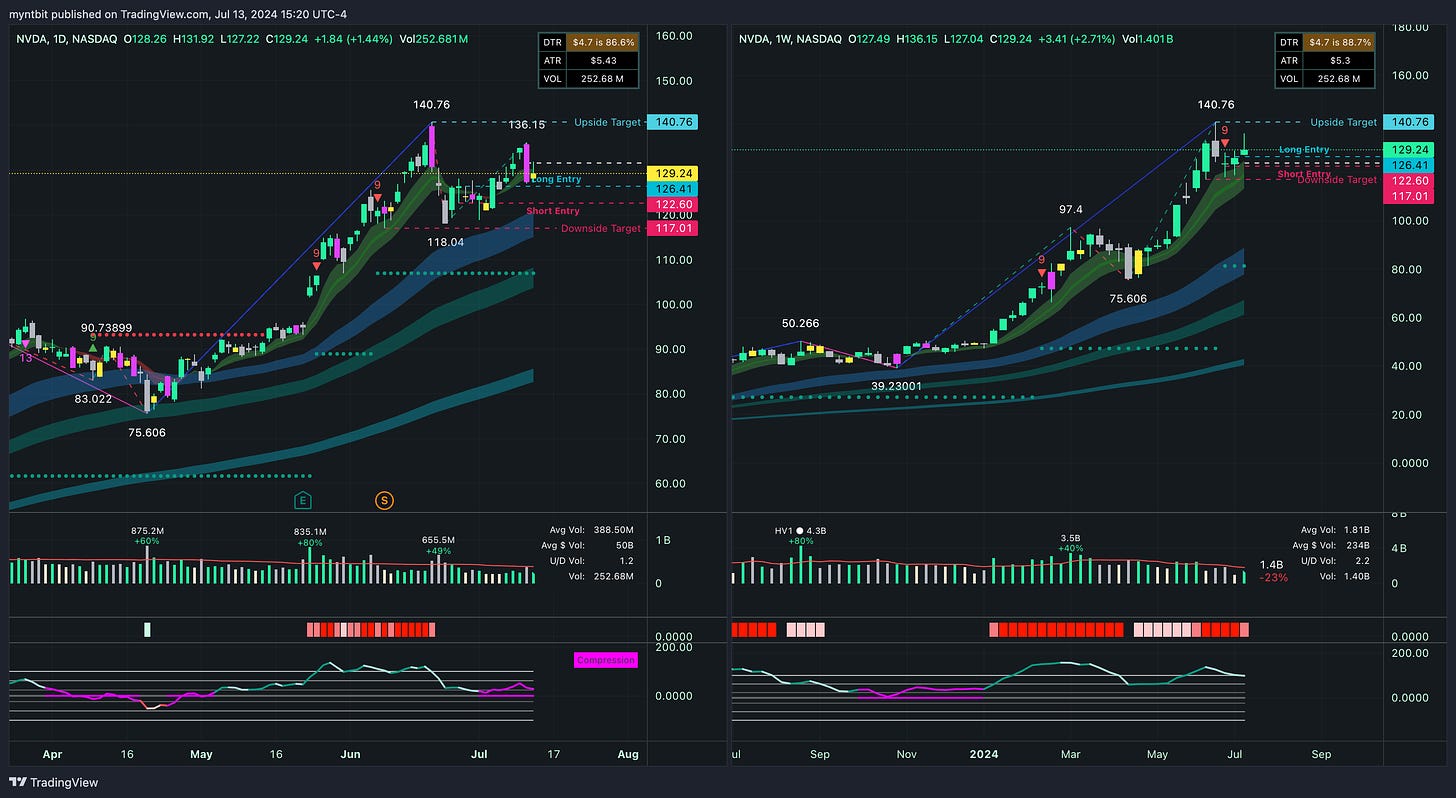
NVDA - Nvidia Corp
NVDA still consolidating. The targets remain the same.
Bull Case: The stock has shown a robust uptrend, with strong volume supporting the price action. The immediate resistance at $140.76 is a critical level to watch. If the stock breaks above this level with strong volume, it could signal a continuation of the bullish trend. The support levels at $126.57 and $117.01 provide potential entry points if the stock pulls back.
Bear Case: The RSI is in overbought territory on both daily and weekly charts, indicating the potential for a pullback. The stock has also shown a bearish MACD crossover on the daily chart, suggesting caution. If the stock fails to hold above the $126.57 support, it could retest lower levels, with the next major support at $117.01.
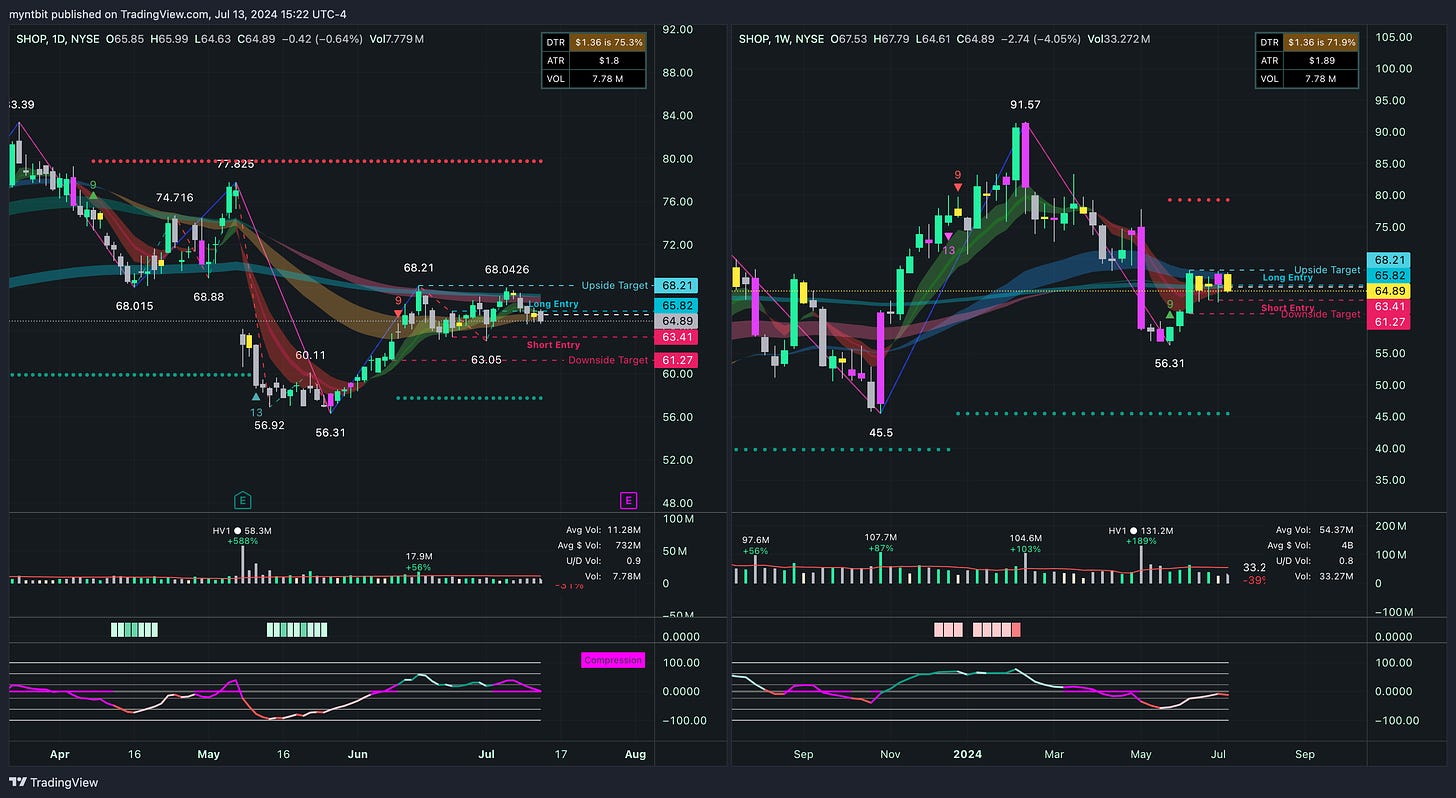
SHOP - Shopify Inc
SHOP hit the upside target. Will be removed from the list.
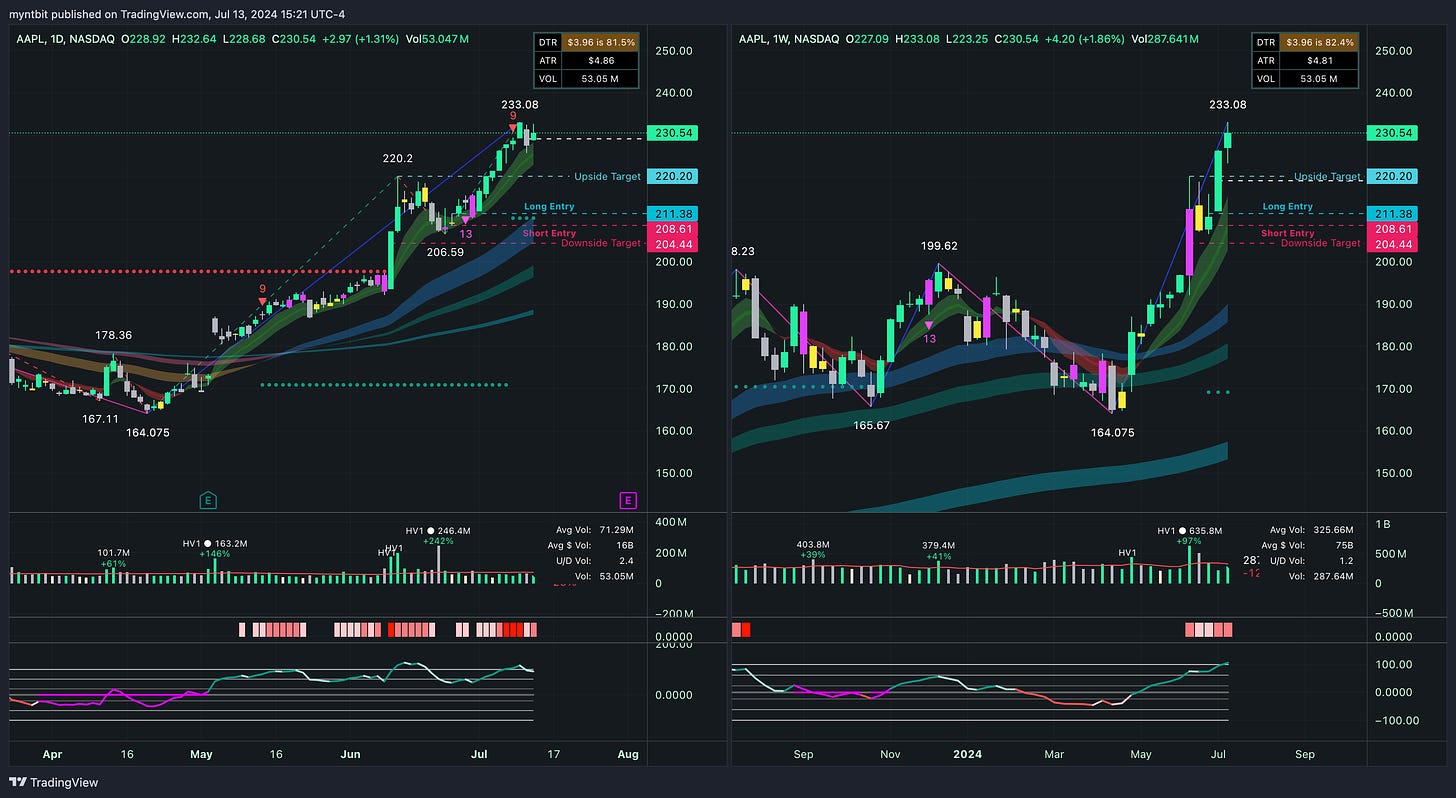
AAPL - Apple Inc
AAPL hit the upside target. Will be removed from the list.
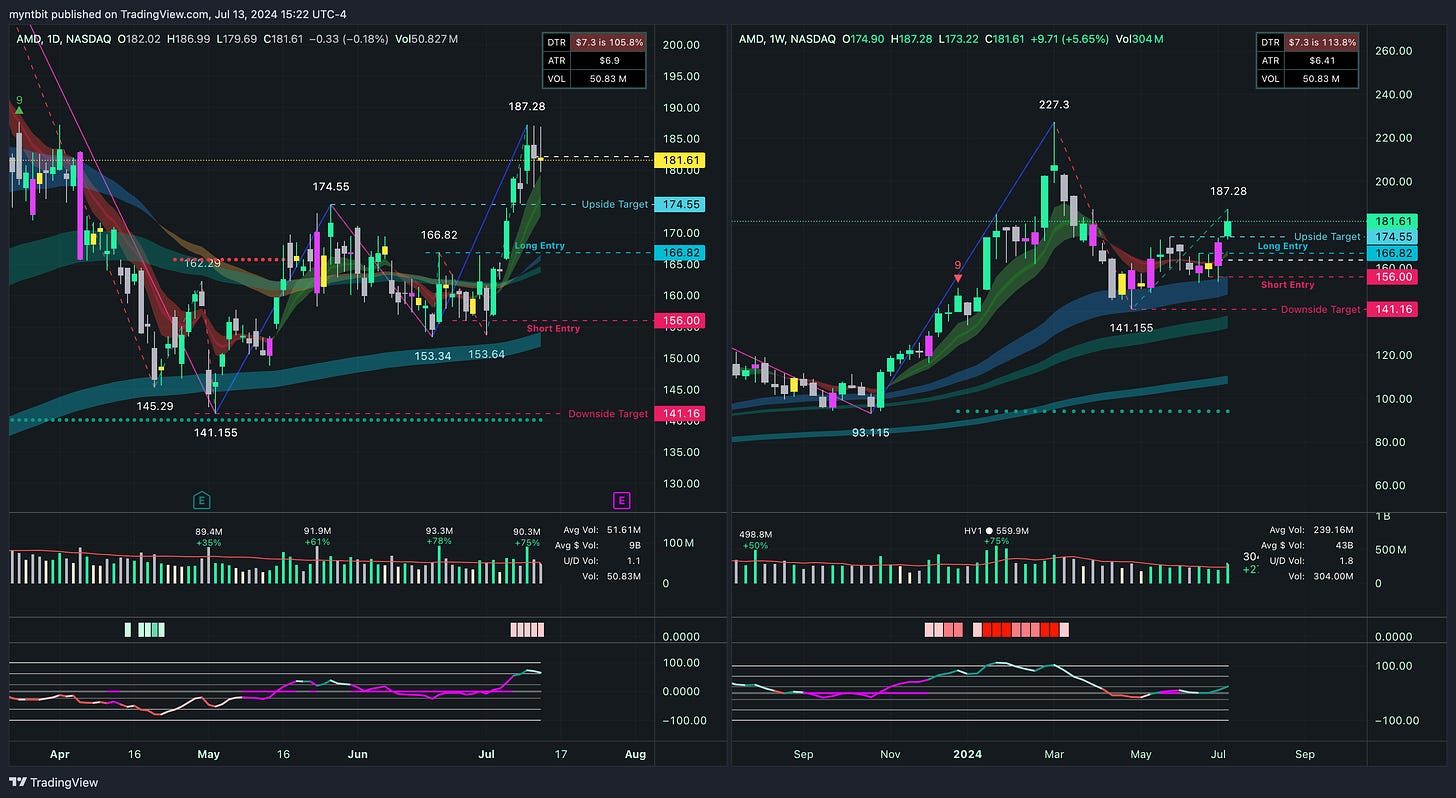
AMD - Advanced Micro Devices Inc
AMD hit the upside target. Will be removed from the list.
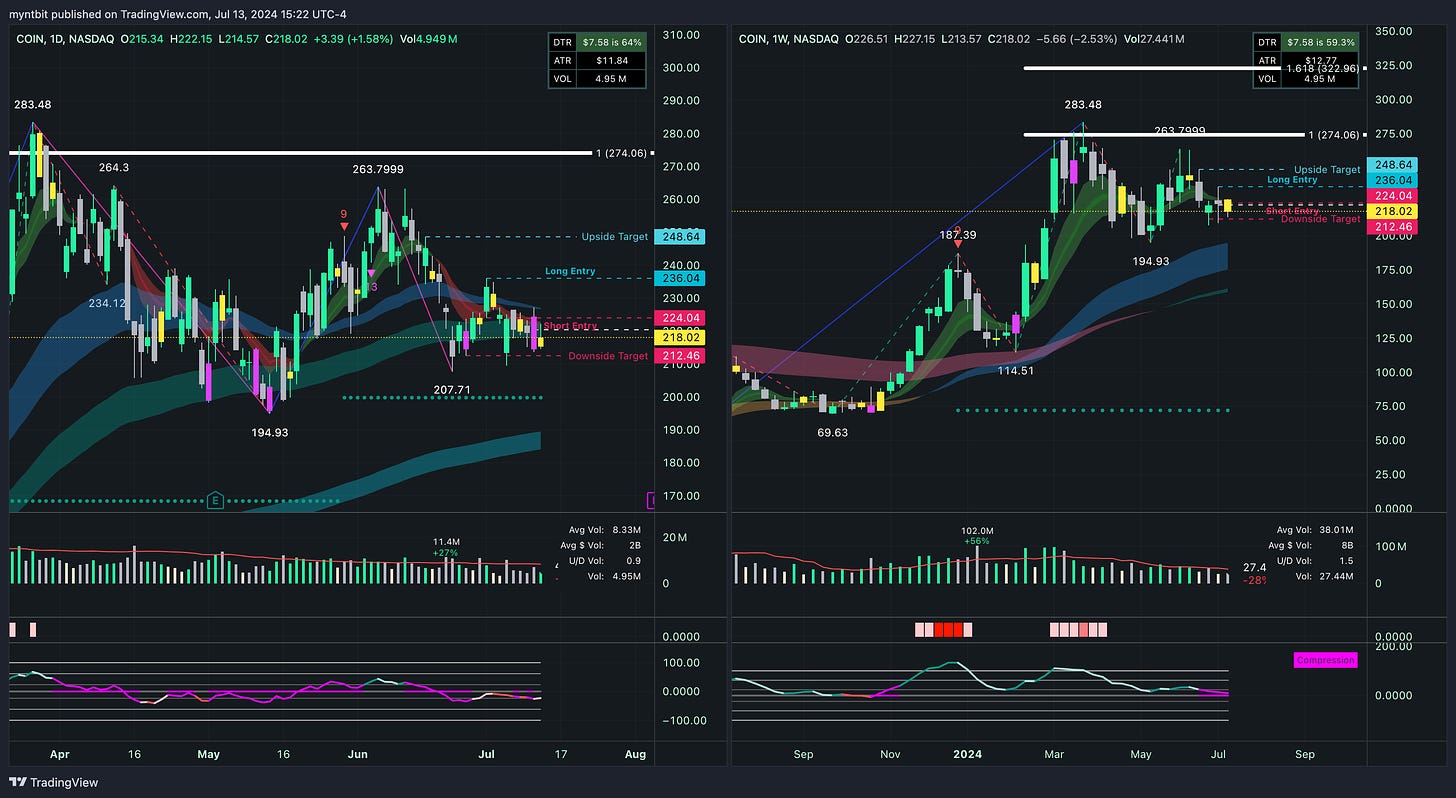
COIN - Coinbase Global Inc
COIN hit the downside target. Will be removed from the list.
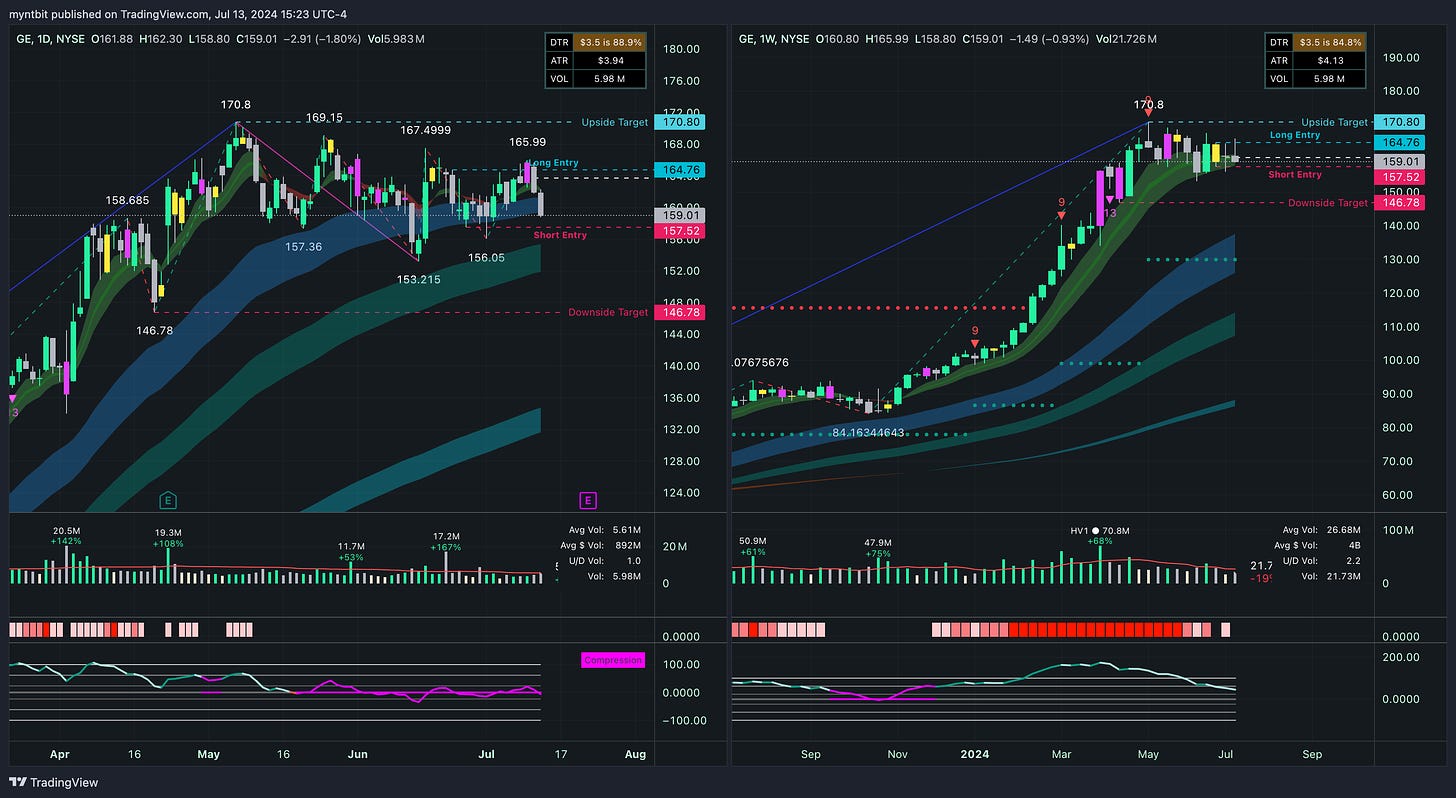
GE - General Electric Co
GE still consolidating. The targets remain the same.
Bullish Case:
If the price breaks above the resistance level of 164.76 on the daily chart, there is potential for a move towards 170.80 and higher.
A sustained move above 170.80 on the weekly chart could indicate a more significant upward trend.
Bearish Case:
The price is currently below key moving averages, suggesting a bearish trend.
The downside targets are at 157.52 and 146.78, which could be tested if the price fails to break above resistance levels.
Stock Watchlist for the Upcoming Week
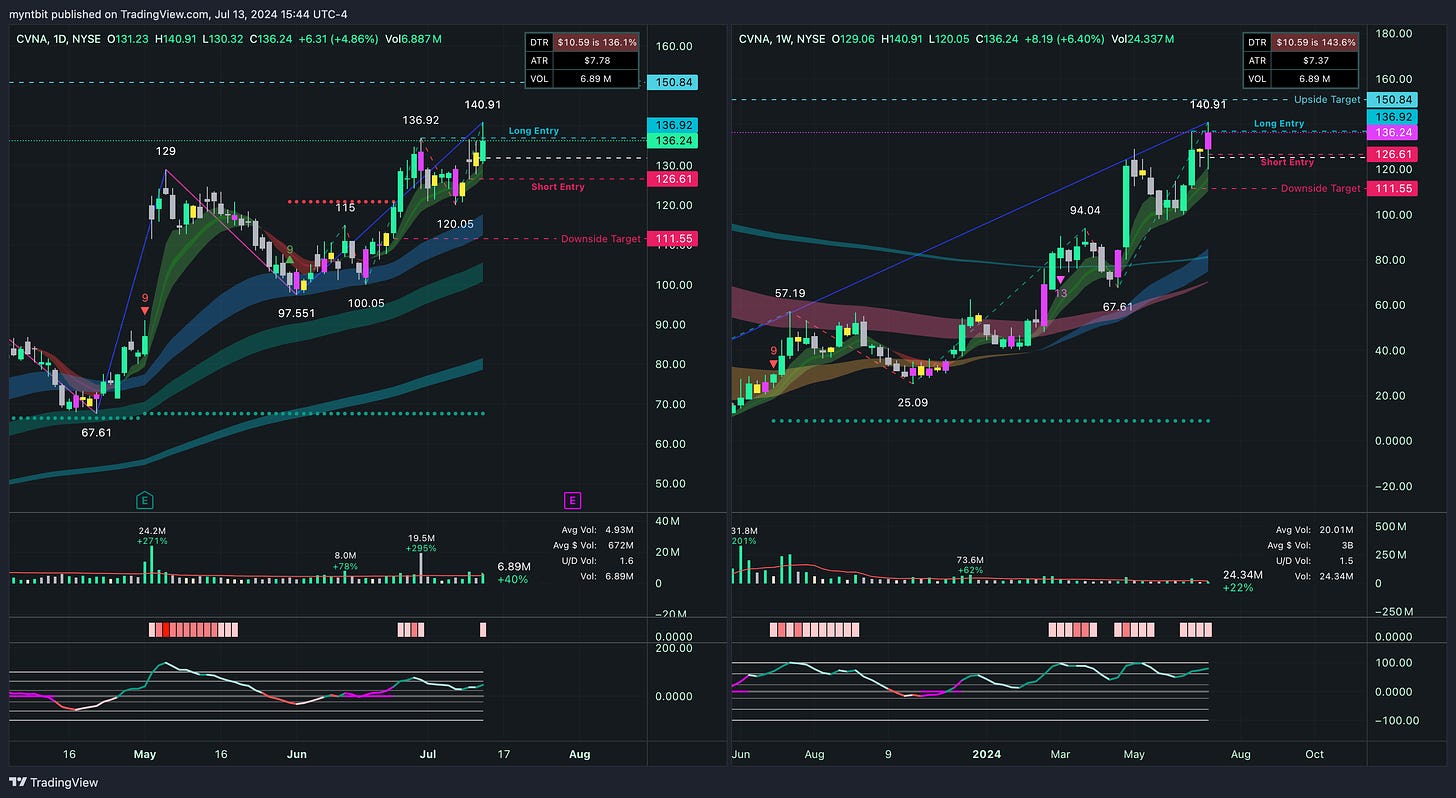
CVNA - Carvana Co. (Freebie)
Bullish Case:
The price breaking and sustaining above 140.91 could indicate further upside towards 150.84, driven by strong momentum and volume.
Bearish Case:
If the price fails to sustain above 140.91 and breaks below 130.00, it could signal a pullback towards the support at 120.00.
Options Opportunity
Call Option: Consider buying a call option with a strike price around 140.00, expiring in the next 1-2 weeks, to capitalize on potential short-term upside.
Put Option: Alternatively, a put option with a strike price around 130.00, expiring in 1-2 months, could be considered if there are signs of a reversal below key support levels.

