MyntBit Weekly Report 07.24 | Big Week Coming up!
The Fed decision is likely to be in the spotlight next week, although traders are also likely to keep an eye on earnings news from a slew of big-name companies.
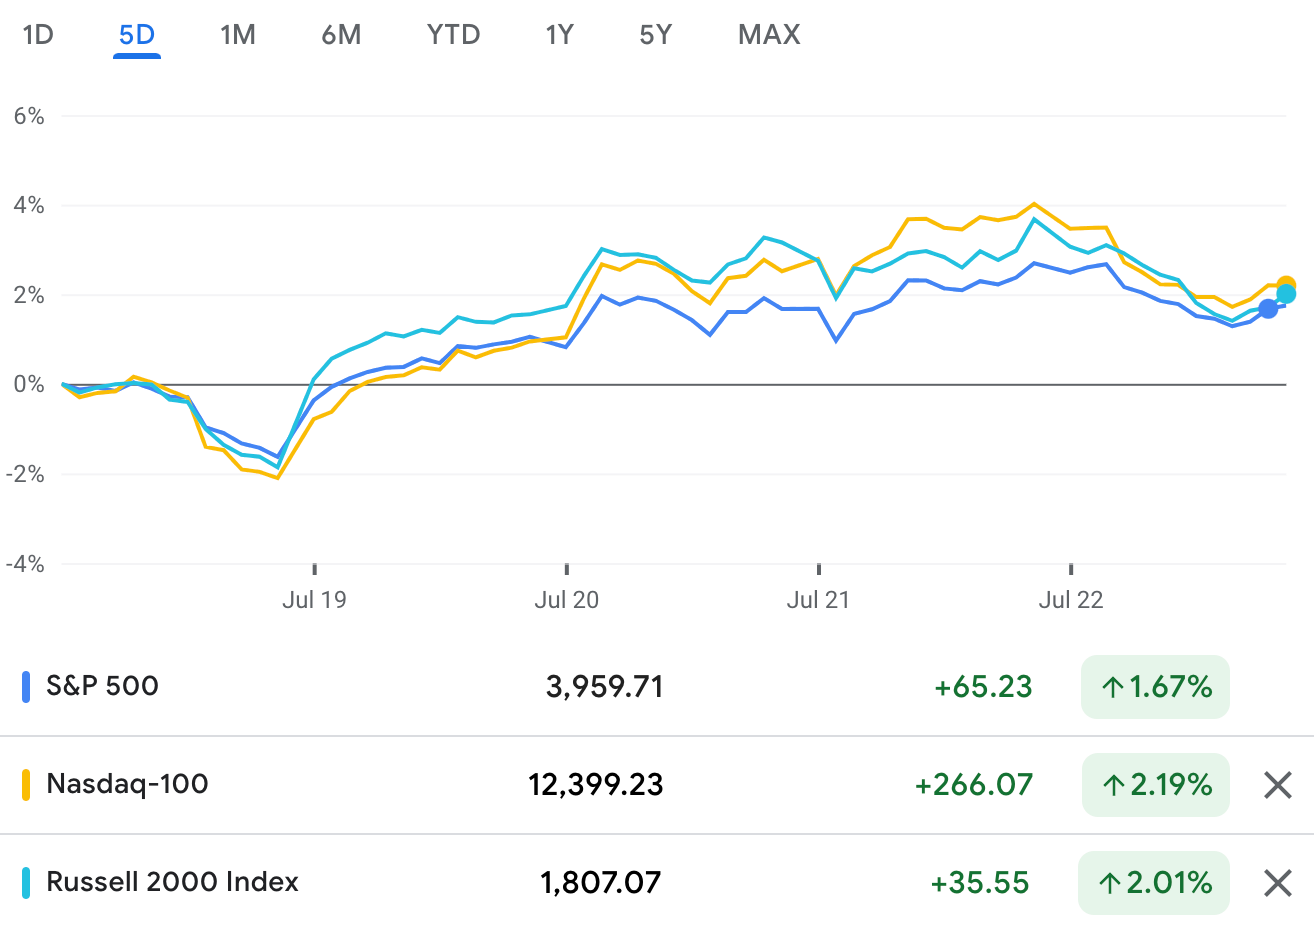
Market Snapshot
Weekly Wrap by Breifing.com
Headlines that reinforced a slower growth environment were persistent this week, but just as persistent -- or resilient we should say -- was the stock market. It did not let the growth worries get it down. In fact, it traded through the growth worries to record a winning week that had been looking a lot better before Snap (SNAP) went crackle pop in the wake of its Q2 earnings report and dour view of conditions for online advertising.
Before the Snap news after Thursday's close, the Nasdaq Composite was up 5.2% for the week and the S&P 500 was up 3.5% for the week. They would eventually close the week with gains of 3.3% and 2.5%, respectively, while the S&P Midcap 400, Russell 2000, and Dow Jones Industrial Average gained 4.0%, 3.6%, and 2.0%.
In turn, they all reclaimed a posture above their 50-day moving average and the S&P 500 briefly traded above 4,000 on Friday after flirting with 3,600 in mid-June.
Overall, it was a good week for stocks despite Friday's pullback but not a good week for the economic outlook. Specifically:
The July NAHB Housing Market Index fell to 55 from 67, registering its biggest monthly drop on record outside of the drop seen in April 2020.
June housing starts were weaker than expected and building permits (a leading indicator) for single-unit dwellings fell in every region.
Existing home sales were weaker than expected in June and declined for the fifth straight month.
Initial jobless claims topped 250,000 for the first time since mid-November 2021.
The July Philadelphia Fed Index fell to -12.3 from -3.3, paced by a sharp decline in the new orders index.
The June Leading Economic Index decreased 0.8%, which was the fourth consecutive decline, prompting the Conference Board to suggest that a U.S. recession around the end of this year and early next year is now likely.
The preliminary July IHS Markit Manufacturing PMI slipped to 52.3 from 52.7 while the IHS Markit Services PMI slumped to 47.0 from 52.7 (a number below 50.0 is indicative of a contraction in business activity).
On top of the economic data, Apple (AAPL), Alphabet's Google (GOOG), Microsoft (MSFT), and Snap (SNAP) were reported to have indicated that they plan to slow their hiring activity.
The deteriorating economic environment registered more in the Treasury market than it did in the stock market. The 2-yr note yield fell 14 basis points for the week to 2.99% and the 10-yr note yield fell 15 basis points for the week to 2.78%. The inversion, whereby shorter-dated securities yield more than longer-dated securities, is a reflection of growth concerns and is seen by some as a harbinger of a possible recession.
The recession view didn't register in the stock market -- not this week anyway. The best-performing sector was the consumer discretionary sector (+6.8%), which was helped by a huge move in Tesla (TSLA) after its better-than-feared Q2 report, followed by the materials (+4.1%), industrials (+4.1%), information technology (+3.6%), and energy (+3.5%) sectors.
Conversely, two of the three sector losers this week were the countercyclical health care (-0.3%) and utilities (-0.5%) sectors.
It was the communication services sector (-1.2%), though, that was the worst-performing sector this week. Netflix (NFLX) did what it could do to lend support, rallying nicely after its better-than-feared Q2 earnings report; however, some gloomy earnings results and/or guidance from AT&T (T) and Verizon (VZ), coupled with the retreat in Alphabet (GOOG) and Meta Platforms (FB) after Snap's disappointment, undercut the sector. Snap for its part plummeted 39% on Friday.
The stock market behaved as if the bad economic news and more challenging earnings environment heard throughout the week was not a surprise. It wasn't in one respect, as the fallout in the first half of the year was largely predicated on a belief that the stock market would be dealing with the bad economic news and more challenging earnings environment it heard about this week.
Aside from that, though, the stock market found a rally catalyst on Tuesday in the BofA Global Fund Manager Survey, which revealed the lowest equity allocation since the Lehman Bros. crisis and the highest cash level since 2001. This news became the focal point for a contrarian-minded approach that supported the market throughout the week.
It overshadowed the poor economic data, as well as the first rate hike from the ECB in 11 years that was more aggressive than most investors expected it would be. Specifically, the ECB raised its key lending rates by 50 basis points when the majority of market participants thought it would raise rates by only 25 basis points. The Bank of Japan for its part left its key lending rate unchanged at -0.10%, as expected.
With clear signs of slower growth and falling long-term rates, it was the growth stocks that took the lead this week in driving the broader market's gains. The Russell 3000 Growth Index was up 3.2% versus a 2.4% gain for the Russell 3000 Value Index. The Philadelphia Semiconductor Index surged 5.5%, aided by reports that the bill that will provide $52 billion for the semiconductor industry should pass the Senate next week.
Want To Learn Volume Profile?

Market Profile
A profile is a type of advanced order flow analysis that shows the volume distribution at different prices over time. Profile, which appears as a horizontal histogram on a chart, can identify important price levels such as support and resistance.
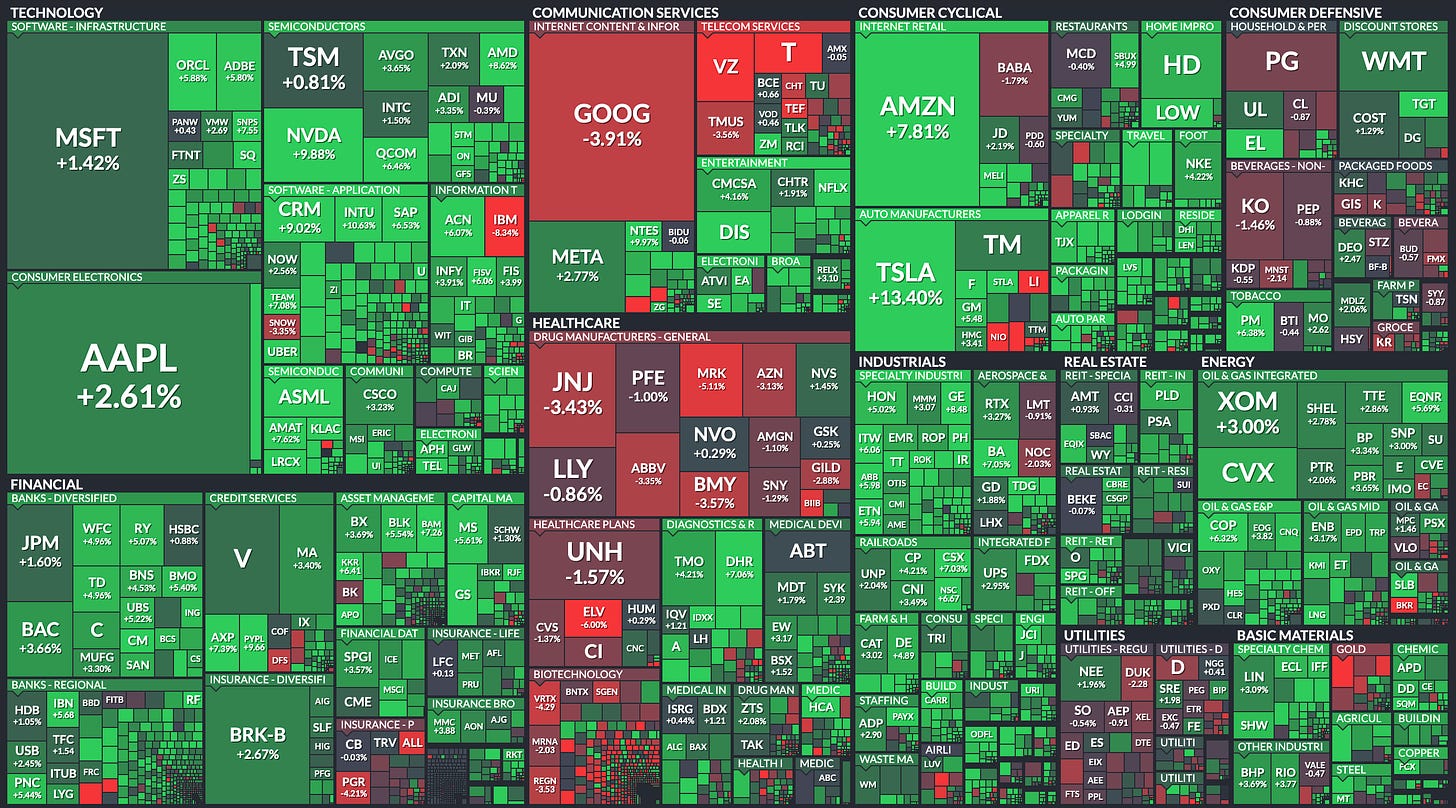
Market Heatmap
Week Ahead by Refinitiv
The U.S. Federal Reserve's Federal Open Market Committee will begin its two-day meeting on interest rate policy on Tuesday. The Federal Reserve is expected to announce on Wednesday it is speeding up the end of its pandemic-era bond purchases and signal a turn to interest rate increases next year as a guard against surging inflation.
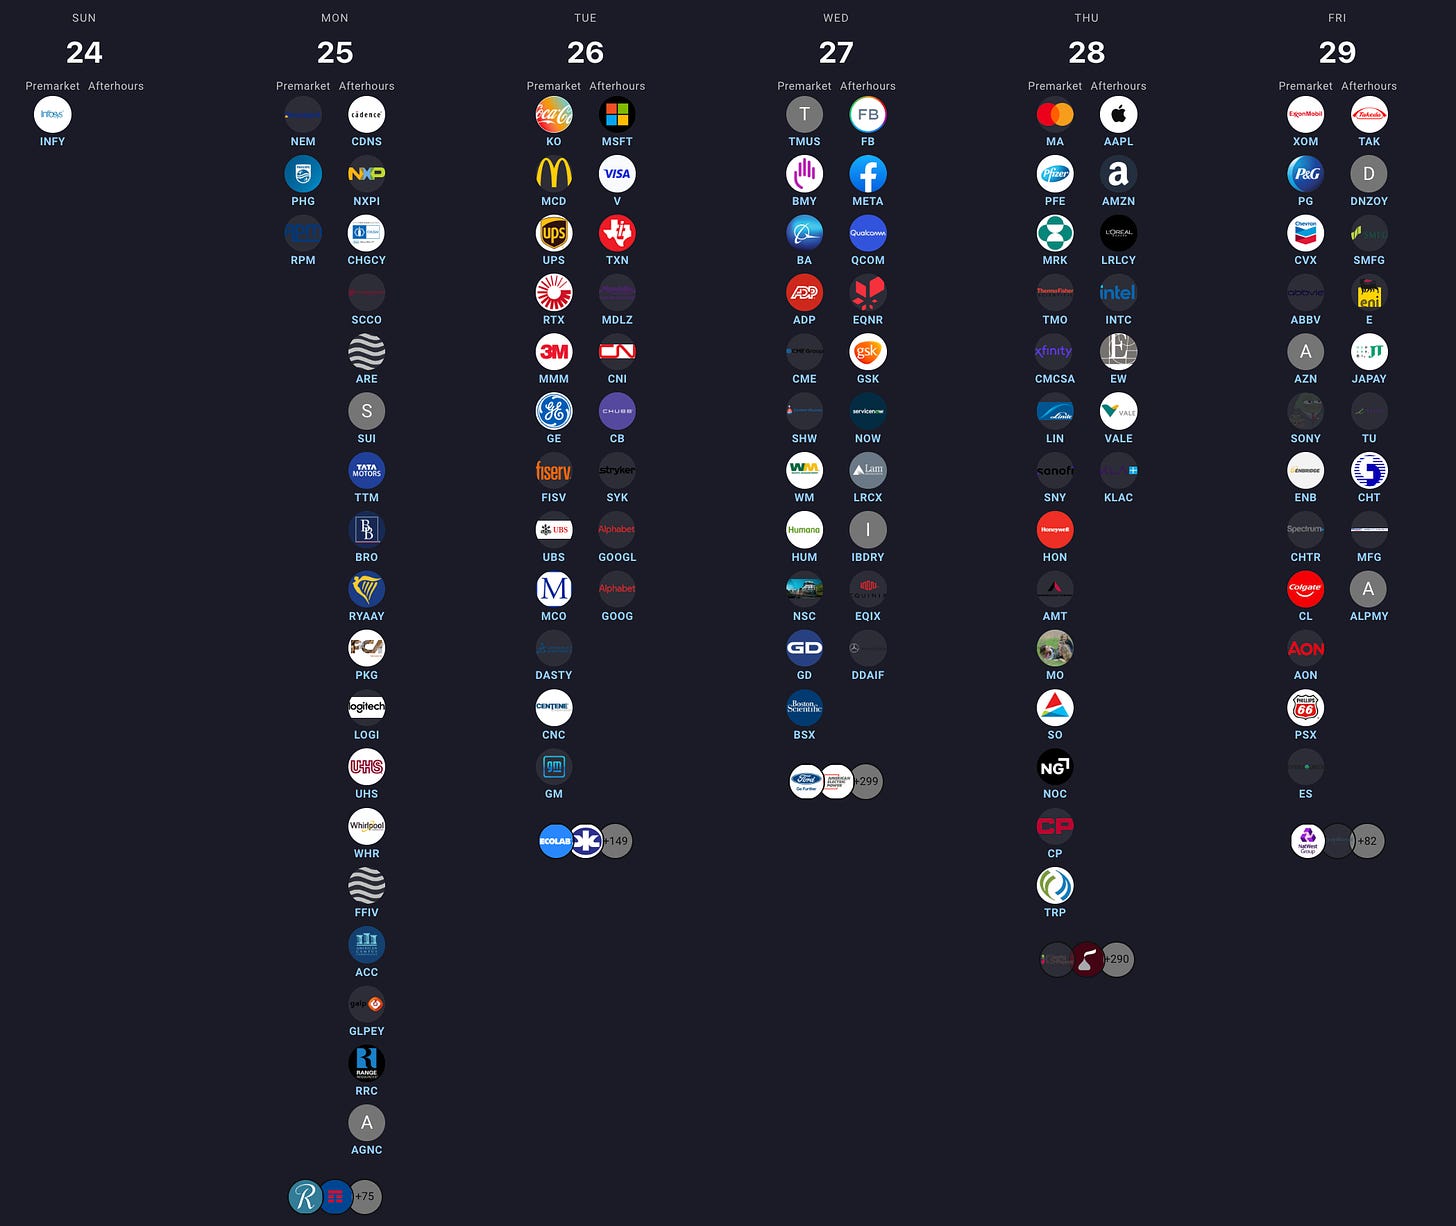
U.S. big tech companies kick off their quarterly earnings next week starting with Google and YouTube-parent Alphabet Inc reporting its second-quarter results on Tuesday. The tech giant is expected to record a slowdown in revenue growth as its ad business takes a hit amid broader macroeconomic uncertainties and as demand for digital as the market cools. On Wednesday, investors will look out for Meta Platforms Inc's second-quarter earnings. The Facebook and Instagram -parent is expected to record its first drop in revenue in over three years, hurt by a slowing market for digital ads globally. Apple Inc will announce its third-quarter earnings after the bell on Thursday, with investors looking to see if the tech company has been able to overcome supply problems and production delays. Separately on Tuesday, software major Microsoft Corp will report fourth-quarter earnings after warning it will take a hit from a stronger greenback.
Visa Inc is scheduled to report its third-quarter earnings after market close on Tuesday. The company is expected to report a jump in profit as spending momentum outpaces gains in inflation. Executives could also provide commentary on the outlook for spending for the rest of the year. Mastercard Inc, another major card issuer, will report its second-quarter earnings on Thursday. The New York-based company is estimated to see a surge in profit as consumers' financial health holds out against decades-high inflation. Investors will also parse through the company’s results for any signs of a slowdown in travel, which accounts for a huge chunk of spending volumes on Mastercard’s network.
On Thursday, Intel Corp is likely to report a fall in second-quarter revenue and net income compared to the corresponding quarter last year, in large part due to dwindling sales of computers where Intel chips go. Analysts will be focused on commentary on demand and any revision to its earnings forecast. On Wednesday, Qualcomm Inc is expected to report a rise in third-quarter revenue as its diversification efforts pay off. Investors will look for commentary on the impact of slowing consumer spending on the smartphone chipmaker's business.
Earnings Calendar (July 24 - 29)
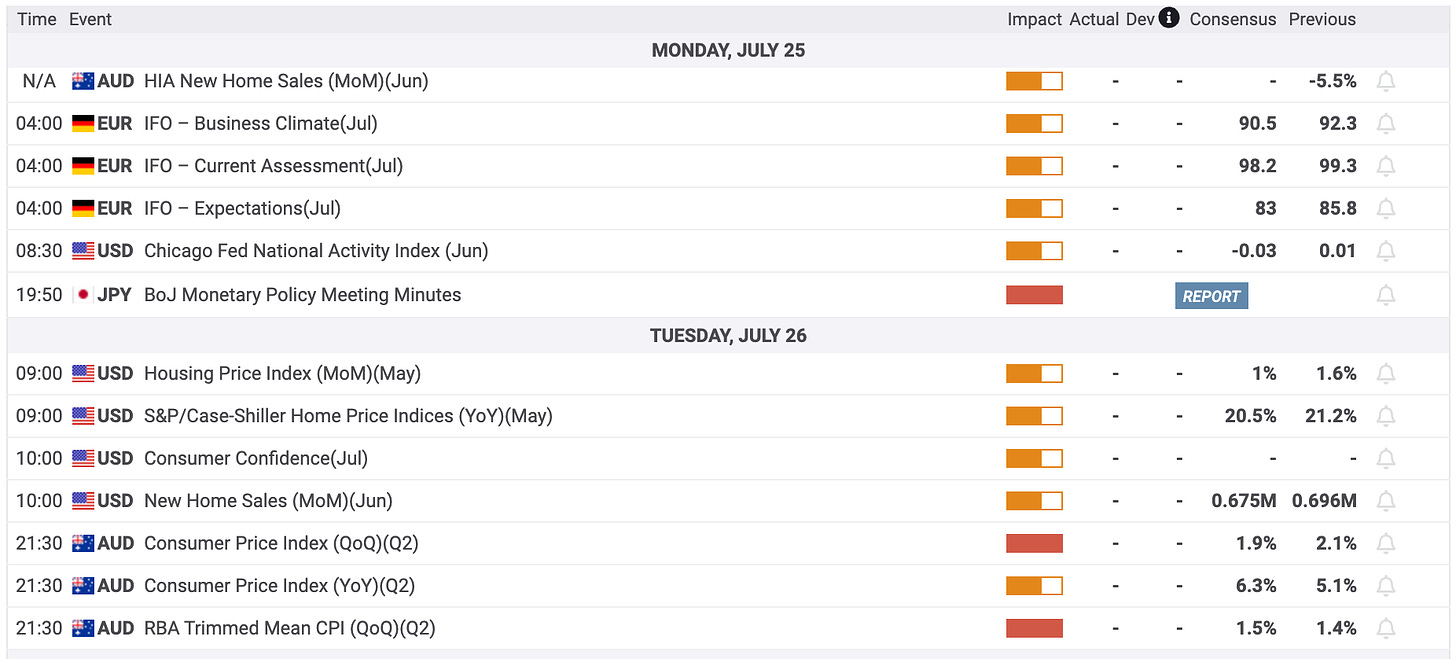
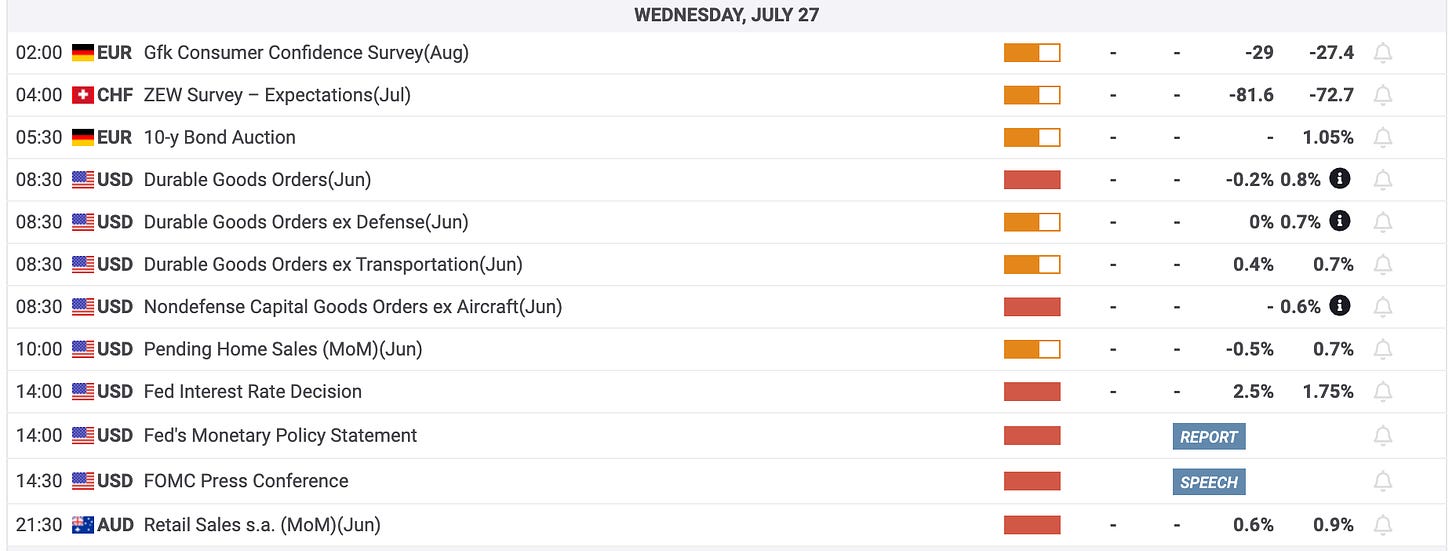
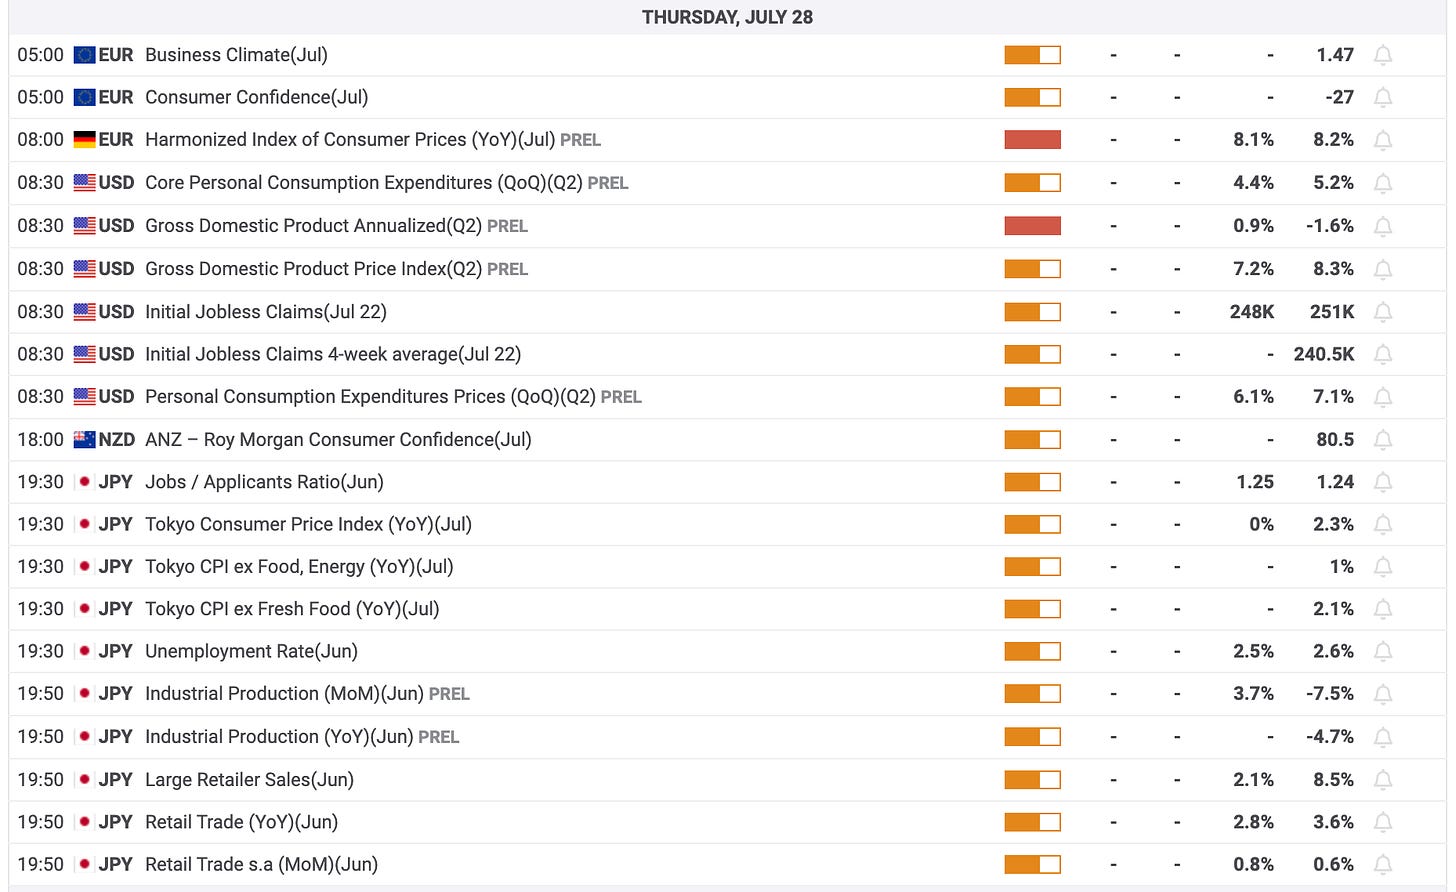
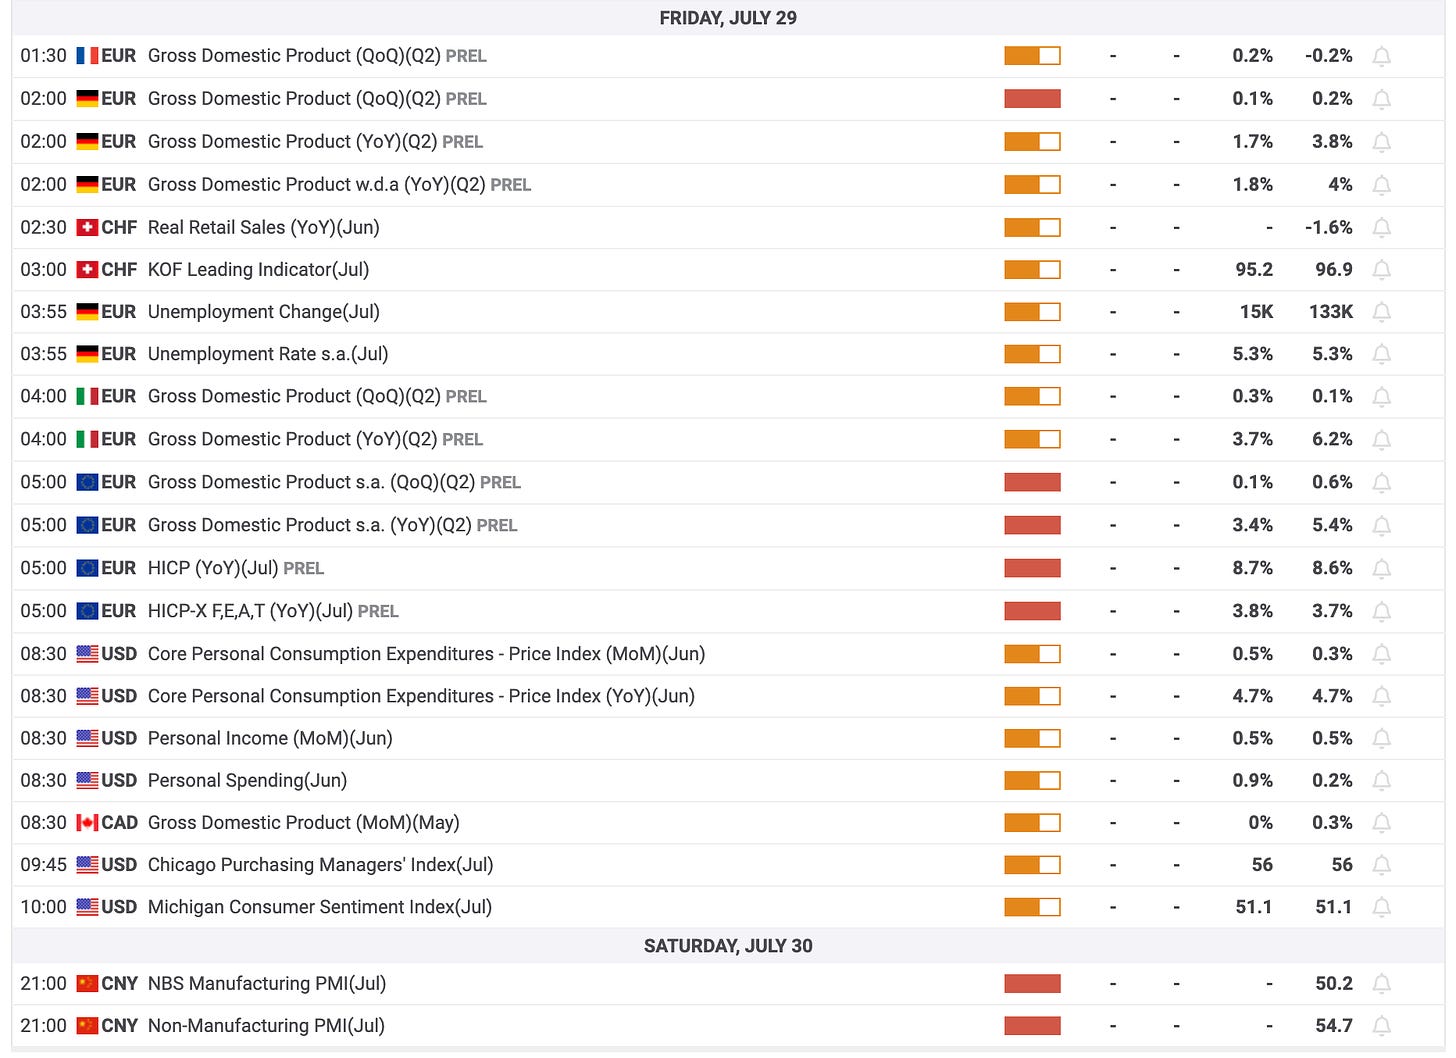
Economic Calendar (July 24 - 29)
On the U.S. economic tap, on Thursday, the Commerce Department in its preliminary estimate is scheduled to report the gross domestic product grew 0.4% in the second quarter. On Tuesday, the Conference Board is expected to report the reading for the consumer confidence index likely dropped 1.2 points to 97.5 in July. On Friday, the consumer spending data, which accounts for more than two-thirds of economic activity, is due for release. Consumer spending likely climbed 0.9% in June after gaining 0.2% in May. Personal income likely remained unchanged at 0.5% in June. The Commerce Department, on Tuesday, is due to report new home sales likely declined to 666,000 units in June from 696,000 in May. On Wednesday, the agency is likely to report durable goods likely dropped 0.5% in June, following a 0.8% rise in the month before. On Thursday, the Labor Department is expected to report initial claims for state unemployment benefits slipped 3,000 to a seasonally-adjusted 248,000 for the week ended July 23. It is also likely to report continuing claims for the week ended July 16.
Futures Markets
/ES - Emini S&P 500
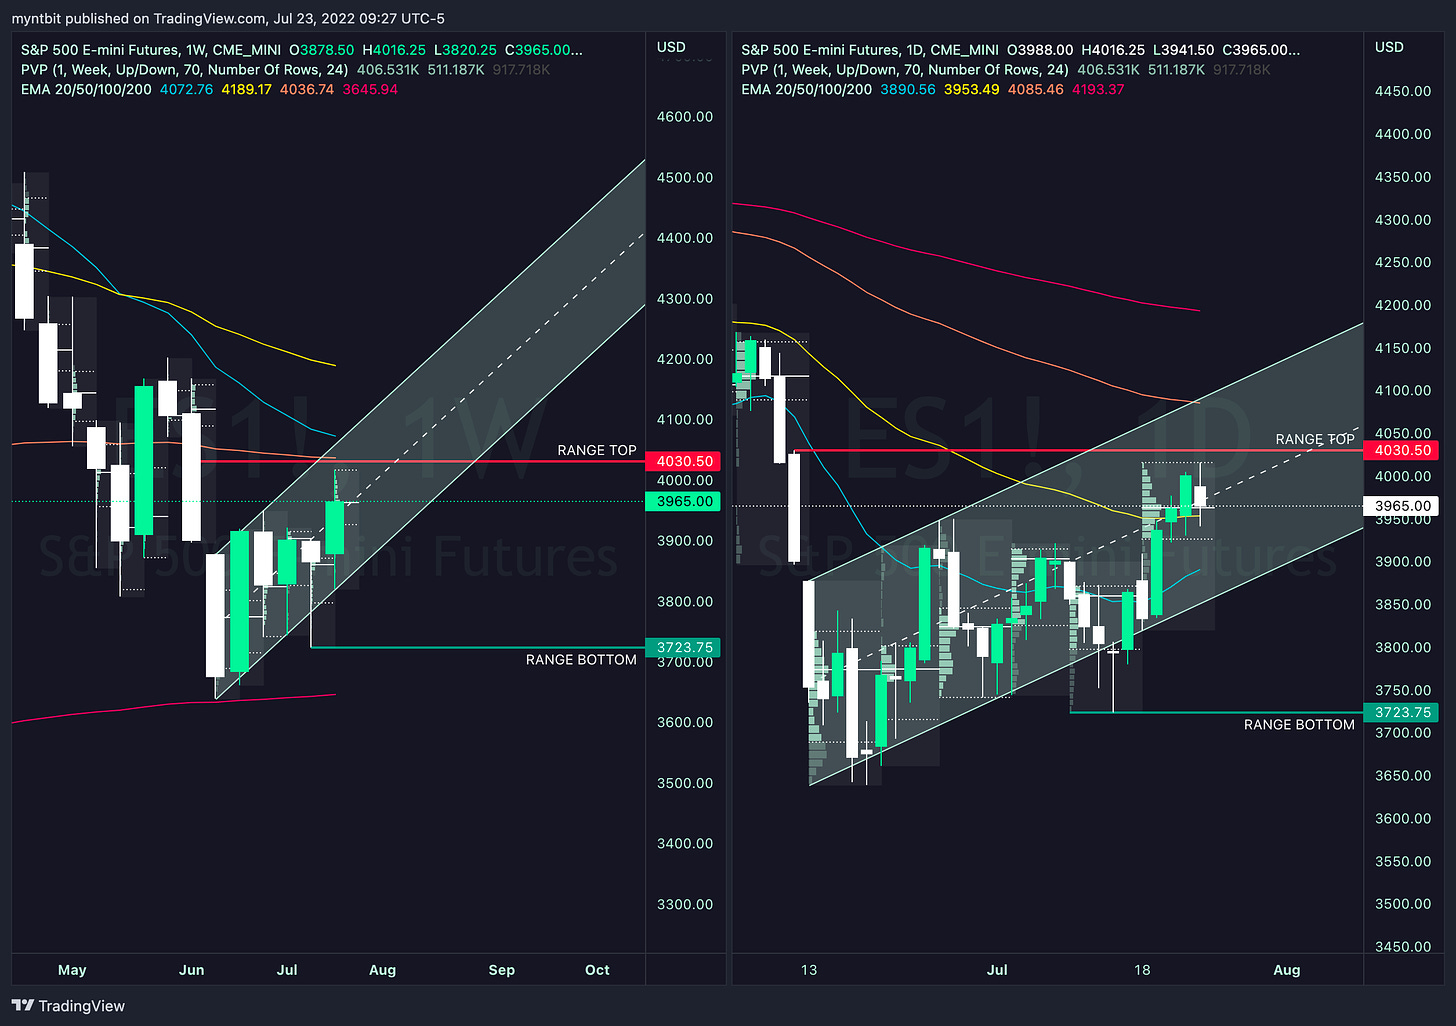
ES broke out of the consolidation range from last week to overtake 4000 briefly then returned back into range. On the weekly timeframe, we rejected 100-day EMA while on the daily timeframe 50 is acting as support. We are expecting a break in the range either on the upside or downside with FOMC/rate decision and earnings coming up this week. It is going to be a fun and volatile week.
Bull Case - 4000 is key. We did manage to test and break 4000 this past week but to see any upside, buyers need to step up and have convection to stay above 4000 but the next stop would be 4030 where we might find meaningful resistance. With the extreme volatility this week with the FOMC decision GDP reading, and key earnings, we could see 4100 highs.
Bear Case - 3950 is a key area. Even with the move higher last week, 3950 acted as a magnet. So, if we remain under 3950, the next level until we find meaningful support is 3900 and then 3830. With the extreme volatility this week with the FOMC decision GDP reading, and key earnings, we could see 3700 lows.
POC: 3954
Range: 3723 - 4030
/NQ - Emini Nasdaq 100
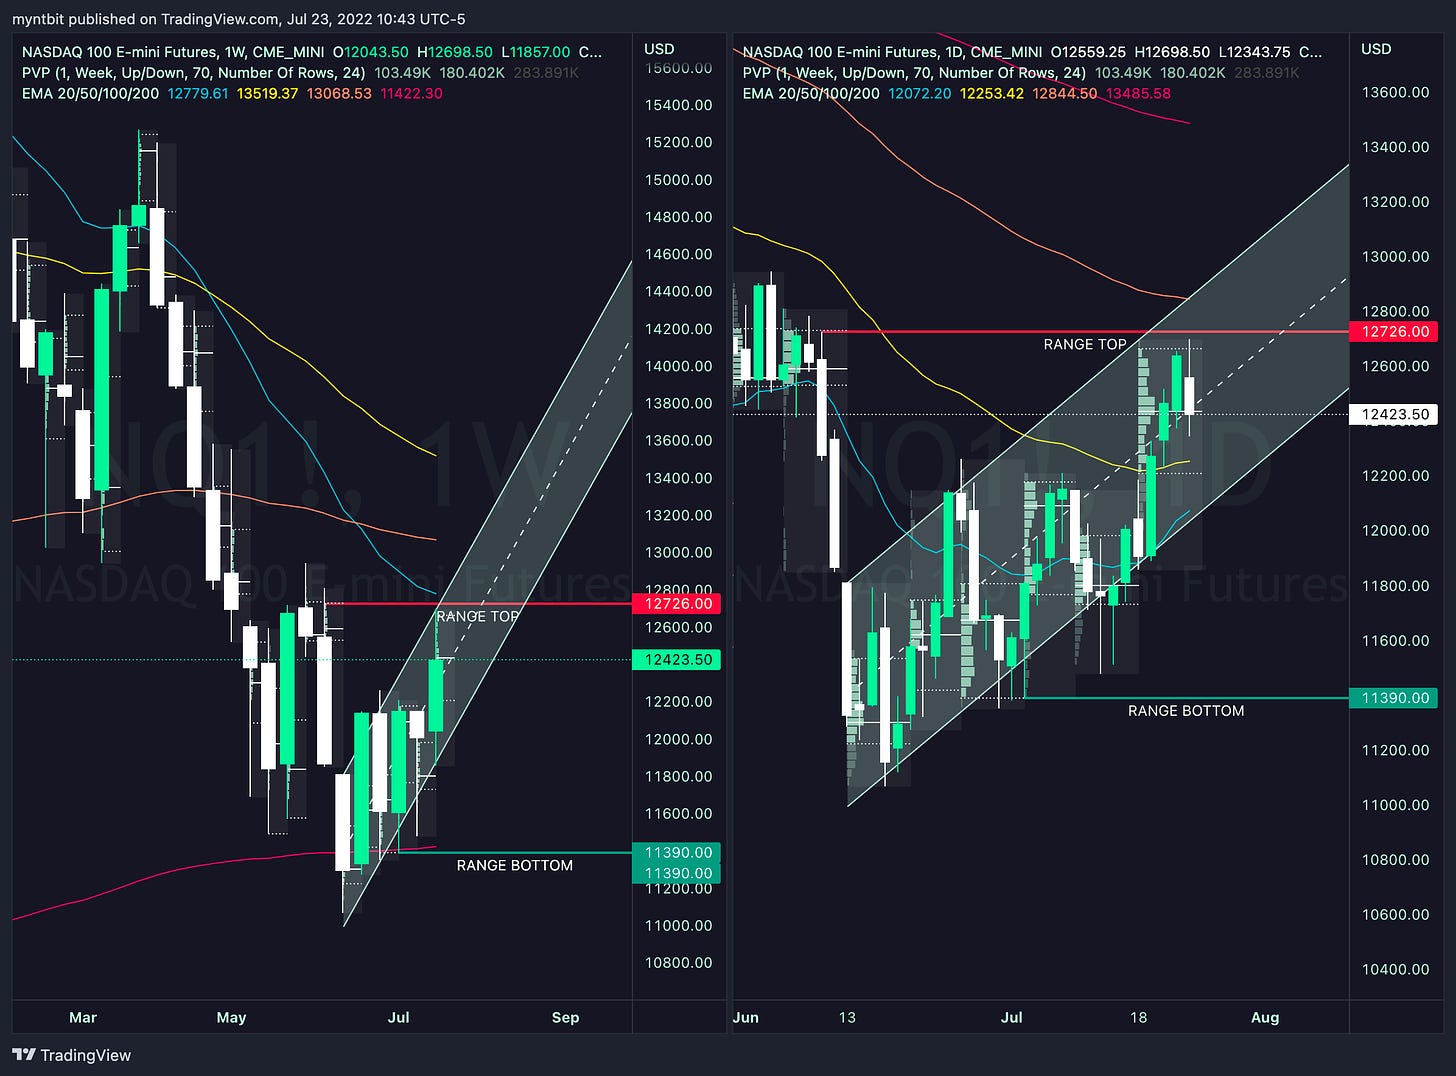
NQ led the rest of the indices to break out of the previous range. On the weekly timeframe, we are under 20-day EMA while on the daily timeframe 50 is acting as support.
Bull Case - Similarly to /ES, this week will be dictated by key data coming out this week. So, a trip to 12900 could be on cards on the upside once the new top of the range 12726 is broken.
Bear Case - If we remain under 12500, we could test 12200 before seeing any meaningful support but with further weakness in NQ, could see 11808 broken which would open the door for lows at 11300 getting tested.
POC: 12440
Range: 11390 - 12726
Stock Watchlist
$AMD - Advanced Micro Devices, Inc.
AMD reports on Aug 2nd, 2022, but recently the stock has risen, thanks to some talk about a chips bill. Also, TSM mentioned a favorable condition going forward during their earnings, which helped AMD and others.
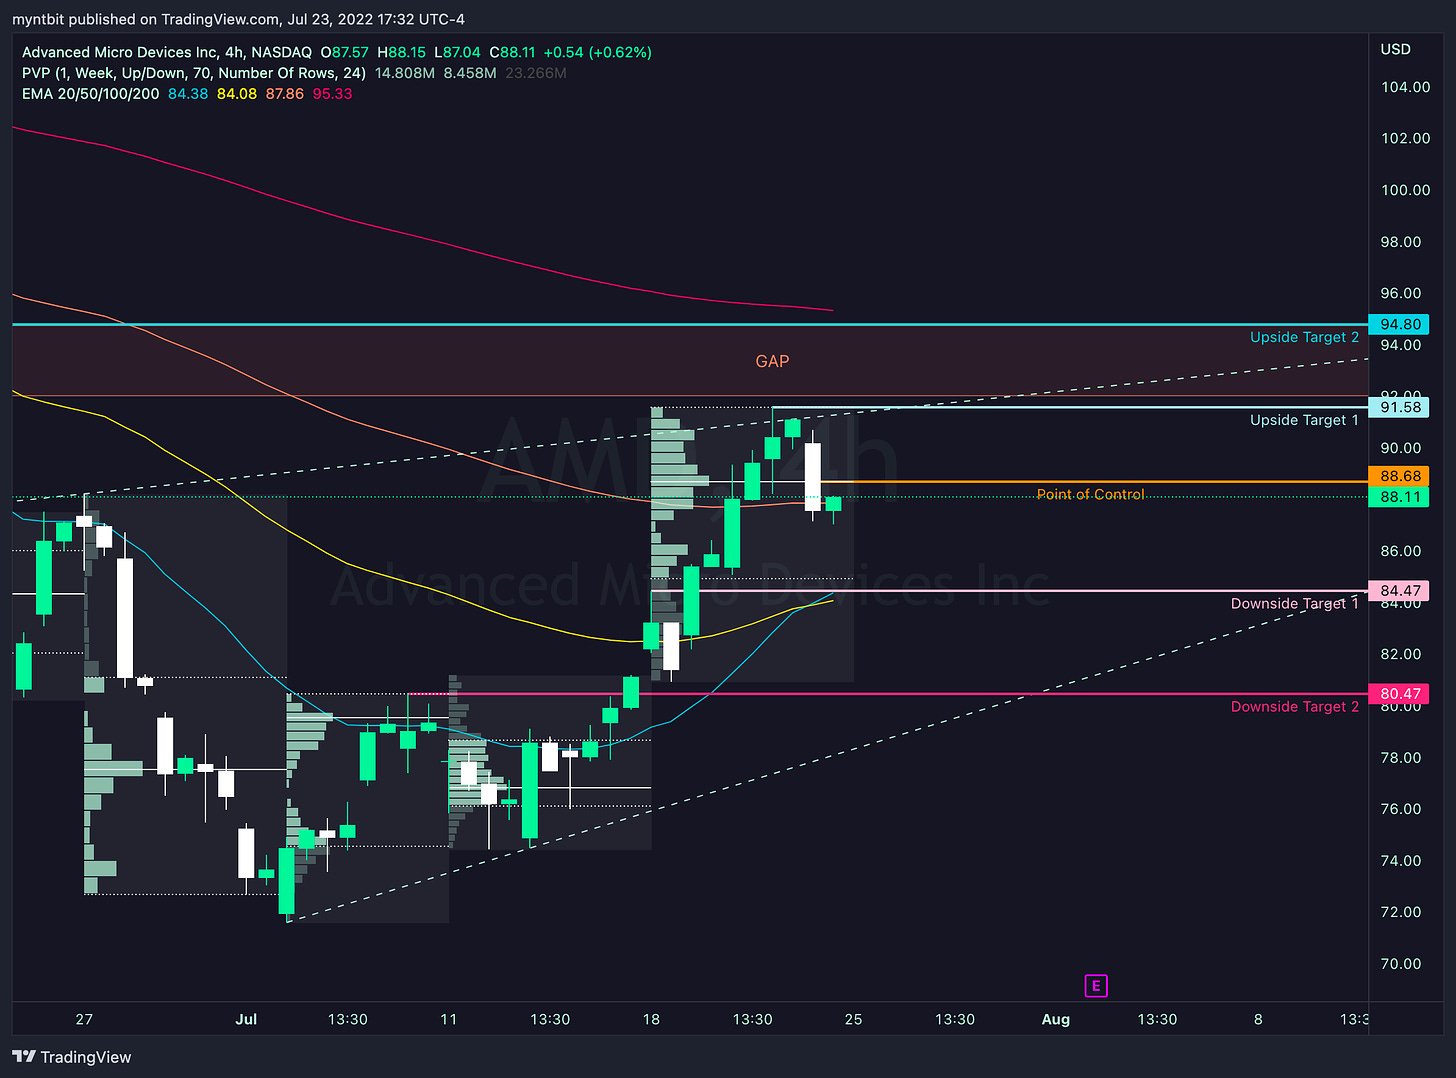
Bull Case - If we OPEN above POC, we might see 91.58 then 94.80.
Bear Case - If we OPEN below POC, we might see 84.47 then 80.47.
There is Gap on the upside at 94.80 that needs to be filled.
POC: 88.68
$V - Visa Inc.
What's bad for the dollar is good for V . The dollar has been in a steady decline lately, and that has been good for companies like MA, V, and AXP.
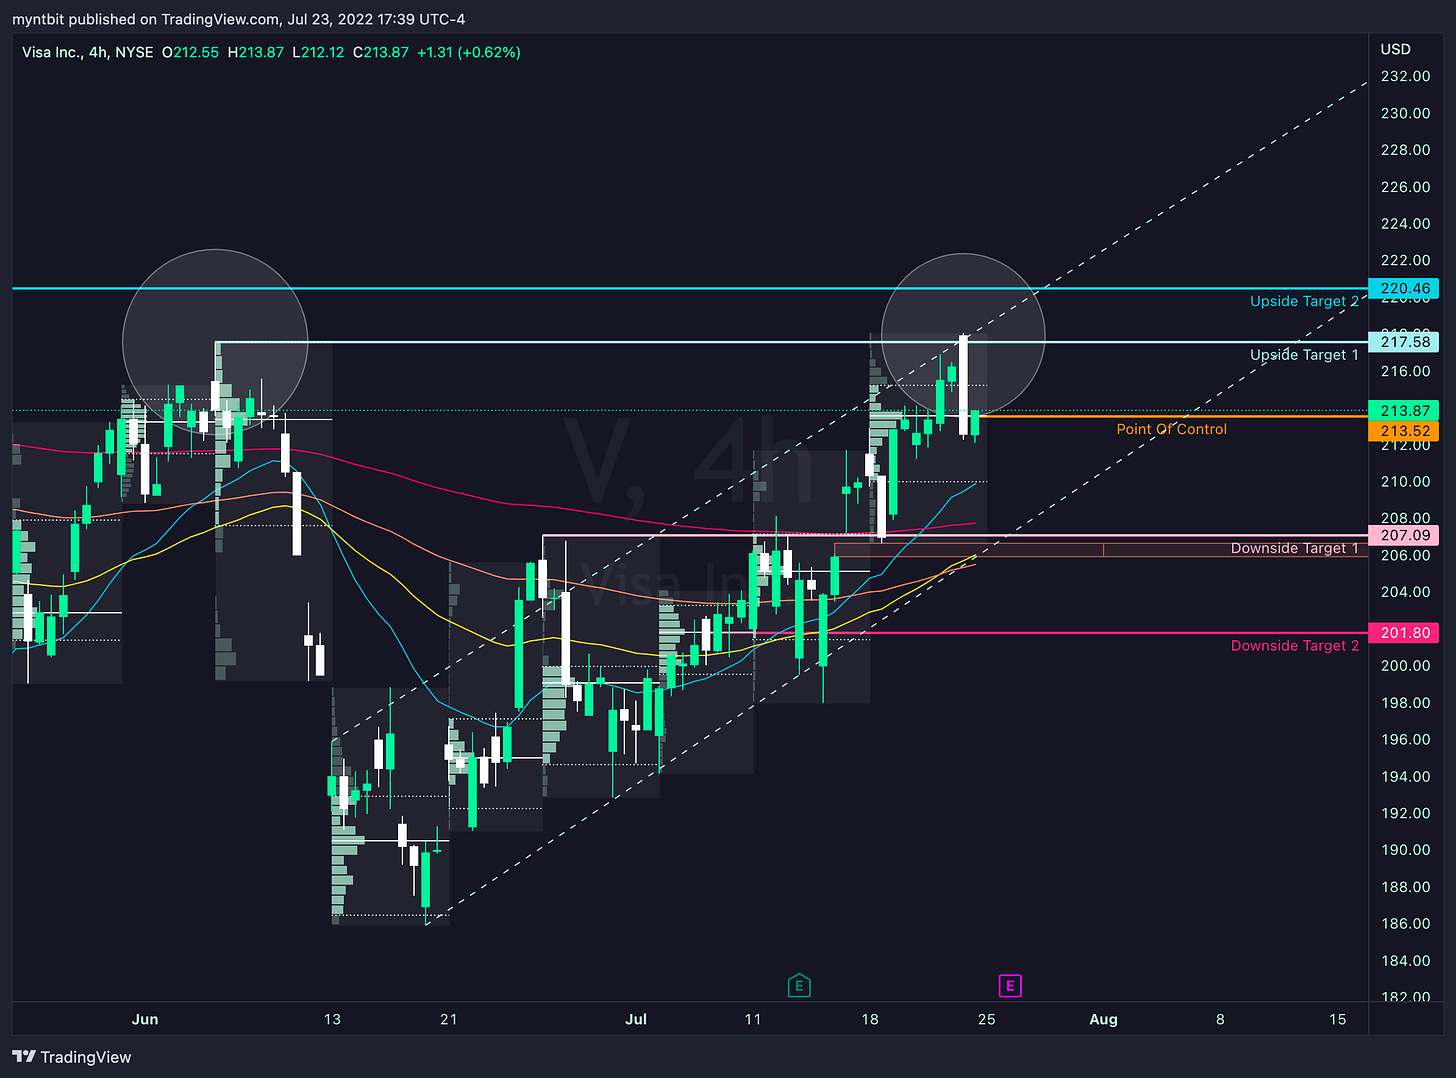
Bull Case - If we OPEN above POC, we might see 217.58 then 220.46.
Bear Case - If we OPEN below POC, we might see 207.09 then 201.80.
There is Gap on the downside at 205.80 that needs to be filled. And there is a double top formed on 4-hour timeframe.
POC: 213.52
$AMZN - Amazon.com, Inc.
Following an incredibly successful Prime Day, AMZN shares surged this week on incredibly high turnover, positioning the stock for a stronger breakout.
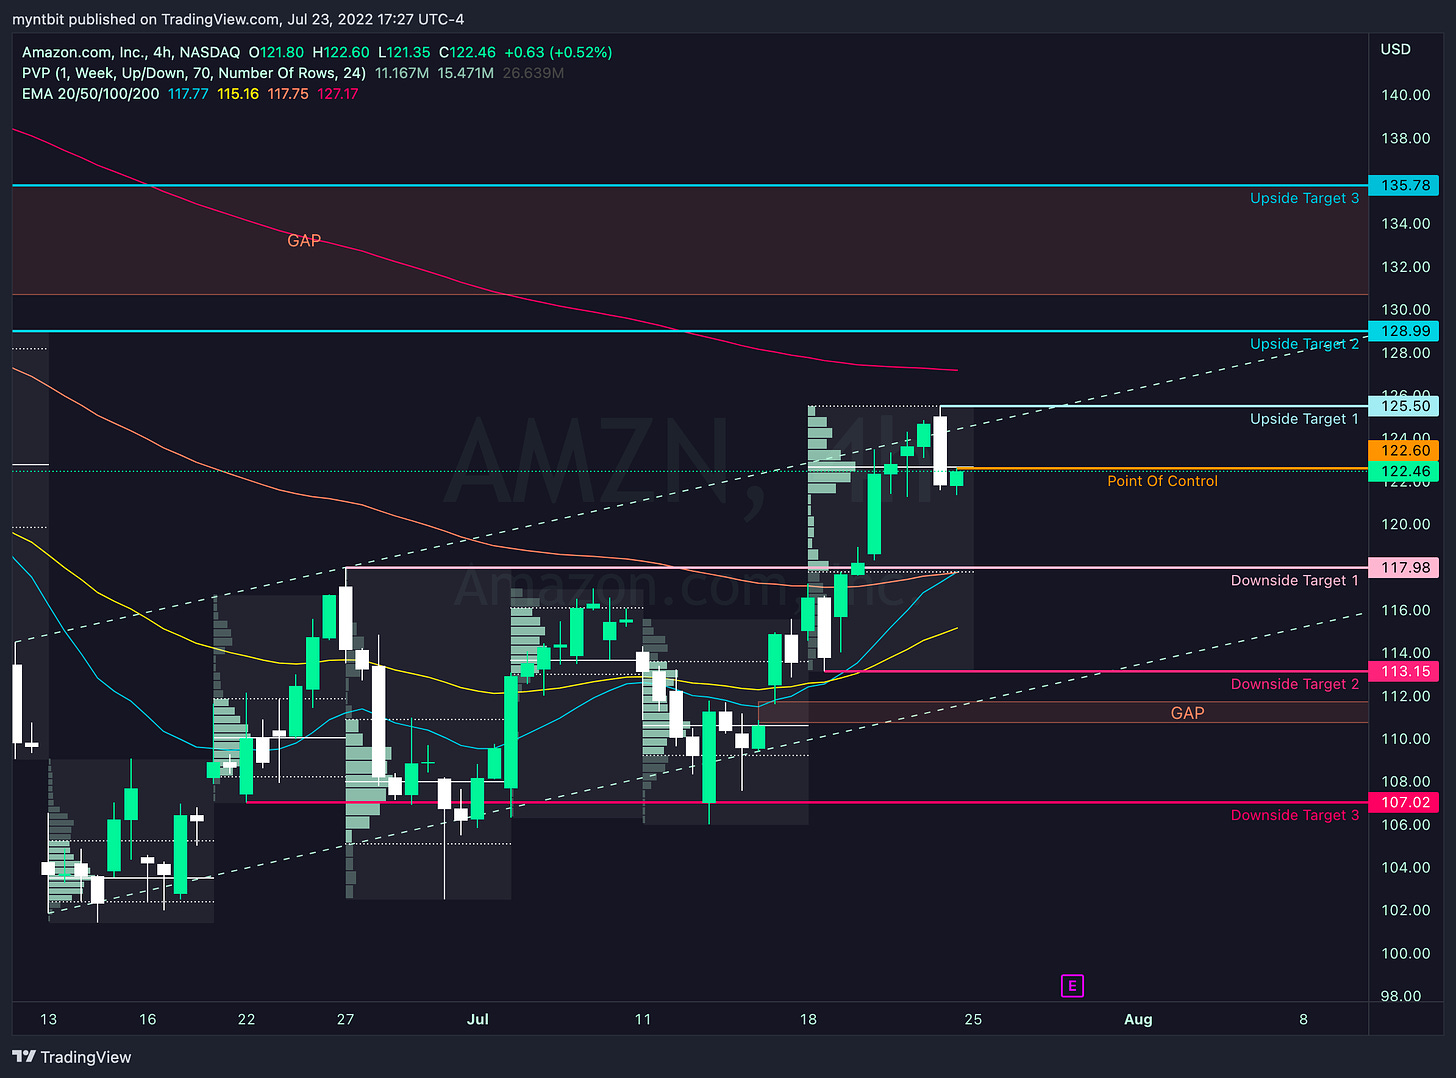
Bull Case - If we OPEN above POC, we might see 125.50, 128.99, and then 135.76.
Bear Case - If we OPEN below POC, we might see 117.98, 113.15, and then 107.02.
There is Gap on the upside at 135.78 that needs to be filled. There is also a gap on the downside at 110.75 that needs to be filled.
POC: 122.80
For more stocks & analysis...

MyntBit on Discord
Our focus is on stocks and options. To learn and interact with other Traders & Investors across the globe. Our goal is to review and discuss the most recent price action in the market in a manner that makes it useful to you.
Our Focus includes:
✔️ Technical Analysis
✔️ Trade Education
✔️ Trend and Pattern Analysis
✔️ Market Psychology
Crypto Markets
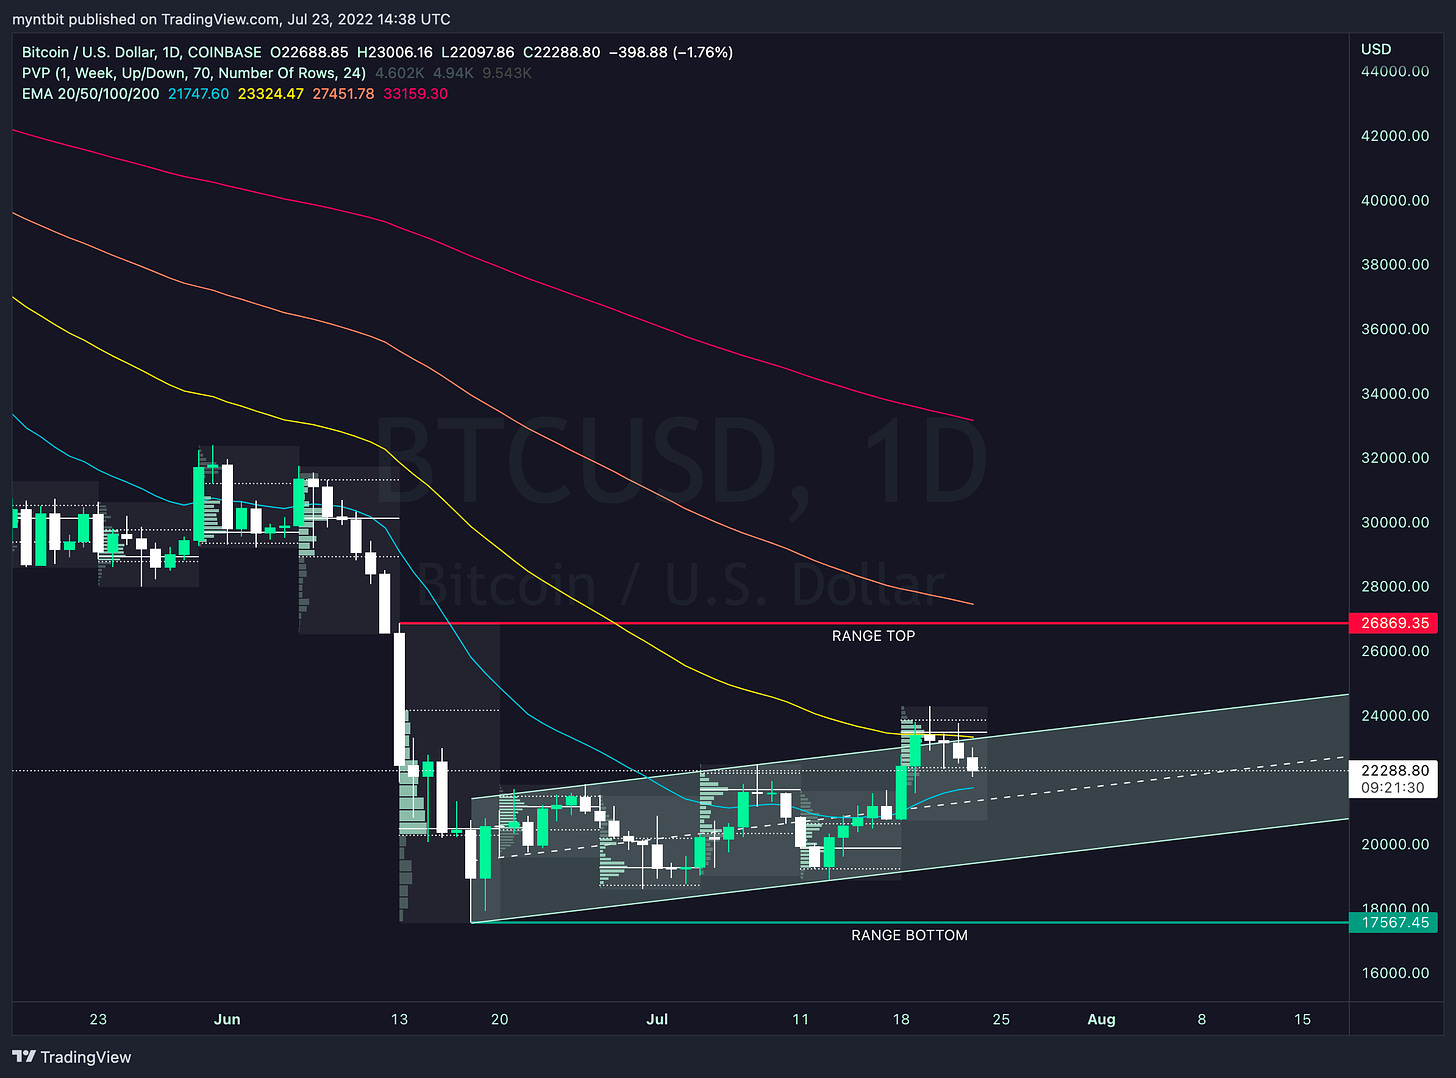
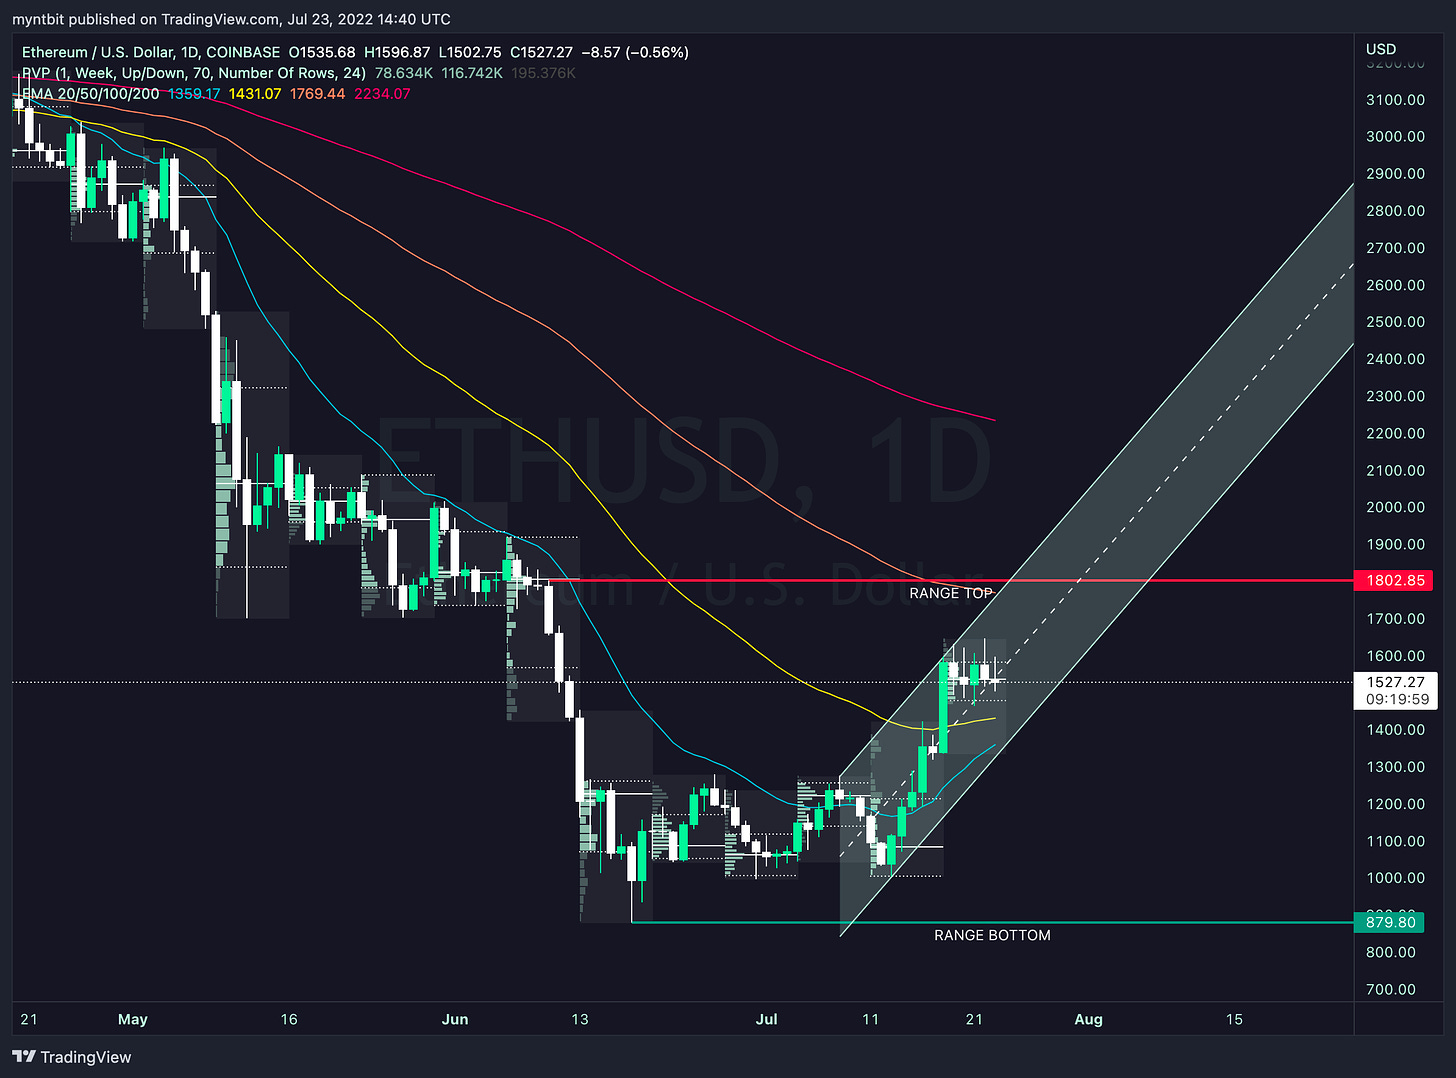
Lastly, Bitcoin and Ethereum finally broke out of their consolidation channel on the upside. ETH led the way with a high of 1640s followed by BTC at 24400. Similar to Equity Markets, this week will be volatile in the crypto space due to key earnings and data releases.
#BTC - Bitcoin
Upside Levels - 22900 > 23500 > 24300
Downside Levels - 21917 > 21300 > 20400
Range: 17567 - 26869
#ETH - Ethereum
Upside Levels - 1594 >1650 > 1800
Downside Levels - 1460 > 1348 > 1279 > 1088
Range: 879 - 1800
Disclaimer: This newsletter is not trading or investment advice, but for general informational purposes only. This newsletter represents our personal opinions which we are sharing publicly for educational purposes. Futures, stocks, bonds trading of any kind involves a lot of risk. No guarantee of any profit whatsoever is made. In fact, you may lose everything you have. So be very careful. We guarantee no profit whatsoever, You assume the entire cost and risk of any trading or investing activities you choose to undertake. You are solely responsible for making your own investment decisions. Owners/authors of this newsletter, its representatives, its principals, its moderators and its members, are NOT registered as securities broker-dealers or investment advisors either with the U.S. Securities and Exchange Commission, CFTC or with any other securities/regulatory authority. Consult with a registered investment advisor, broker-dealer, and/or financial advisor. Reading and using this newsletter or any of my publications, you are agreeing to these terms. Any screenshots used here are the courtesy of Briefing.com, FXstreet, Google Finance, Unusual Whale, Refinitiv, and/or Tradingview. We are just an end-user with no affiliations with them.


