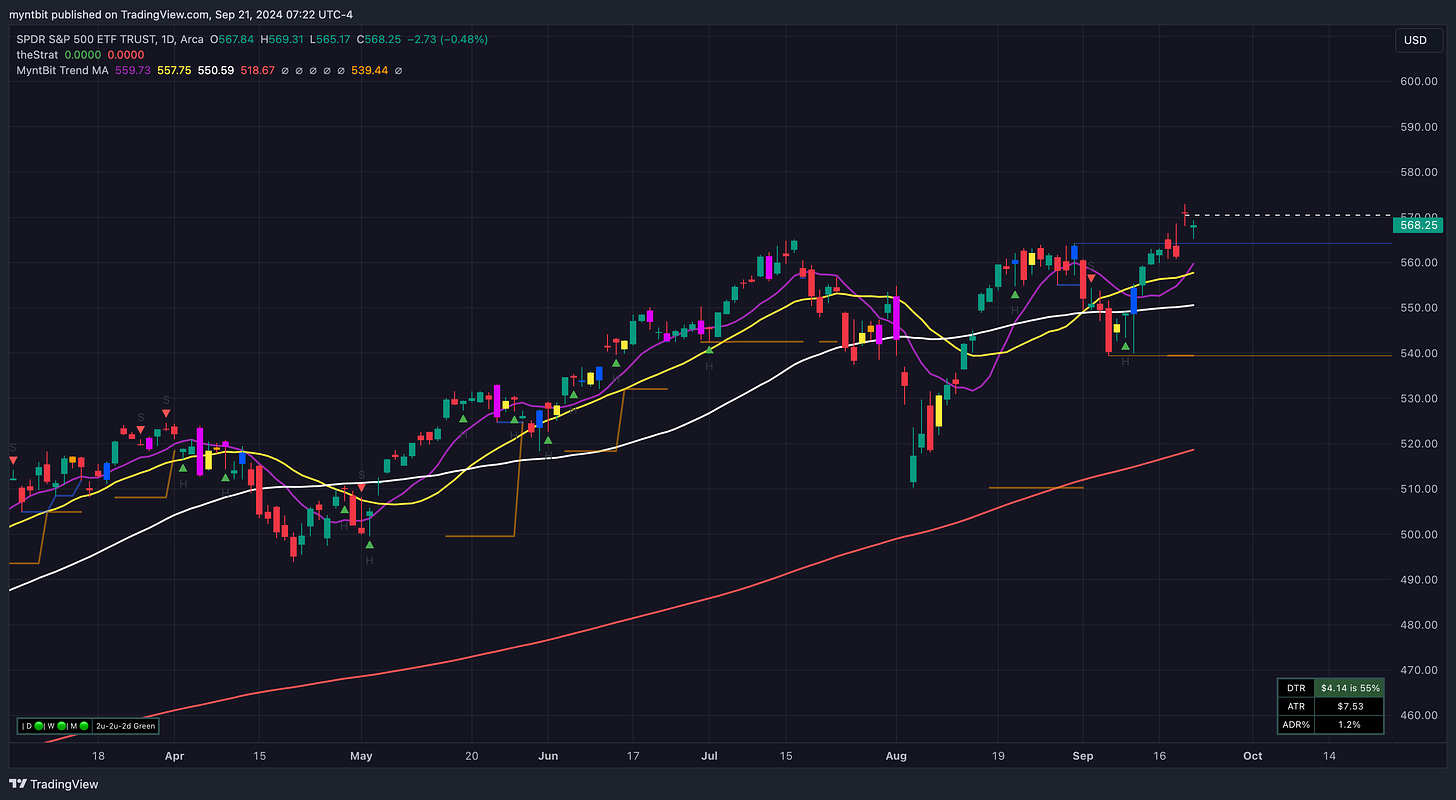
Strategy: Moving Average
Moving averages are a powerful tool in technical analysis, offering insights into both short-term momentum and long-term trends.
Moving averages (MAs) are a fundamental tool in technical analysis, offering a simplified view of price trends by smoothing out price fluctuations. Two of the most popular types of moving averages are the Simple Moving Average (SMA) and the Exponential Moving Average (EMA). Traders often use combinations of EMAs and SMAs across different timeframes to capture both short-term and long-term trends. In this article, we’ll explore the differences between EMAs and SMAs, and discuss a common combination of using 10 and 21-period EMAs along with 50 and 200-period SMAs.
Simple Moving Average (SMA)
A Simple Moving Average is calculated by taking the average of a security's price over a set number of periods. For example, a 50-day SMA adds up the closing prices for the last 50 days and divides by 50. The result is a single point on a line that smooths out short-term fluctuations in price to give a clearer picture of the trend.
Advantages:
Easy to calculate and interpret.
Good for identifying longer-term trends.
Disadvantages:
Slow to respond to sudden price changes since each period has equal weight.
Exponential Moving Average (EMA)
The Exponential Moving Average gives more weight to recent prices, making it more responsive to price changes than the SMA. The formula includes a smoothing factor that makes the EMA "react" faster to recent price action, making it popular among short-term traders.
Advantages:
More sensitive to recent price changes.
Ideal for catching short-term trends.
Disadvantages:
Can generate false signals during periods of consolidation due to its sensitivity.
Combining 10 & 21 EMAs with 50 & 200 SMAs
Many traders combine EMAs and SMAs to get the best of both worlds—capturing short-term price movements while maintaining a clear view of long-term trends. A common combination involves using 10 and 21-period EMAs for short-term signals and 50 and 200-period SMAs for broader market context.
10 and 21 EMA: Capturing Short-Term Trends
The 10 and 21-period EMAs are commonly used by traders to detect momentum and early trend shifts.
10 EMA: The 10-period EMA is a very short-term indicator that tracks the recent price action closely. It’s often used to determine immediate momentum.
21 EMA: The 21-period EMA is slightly longer, smoothing out more of the short-term fluctuations while still being responsive enough for short- to medium-term trends.
Usage:
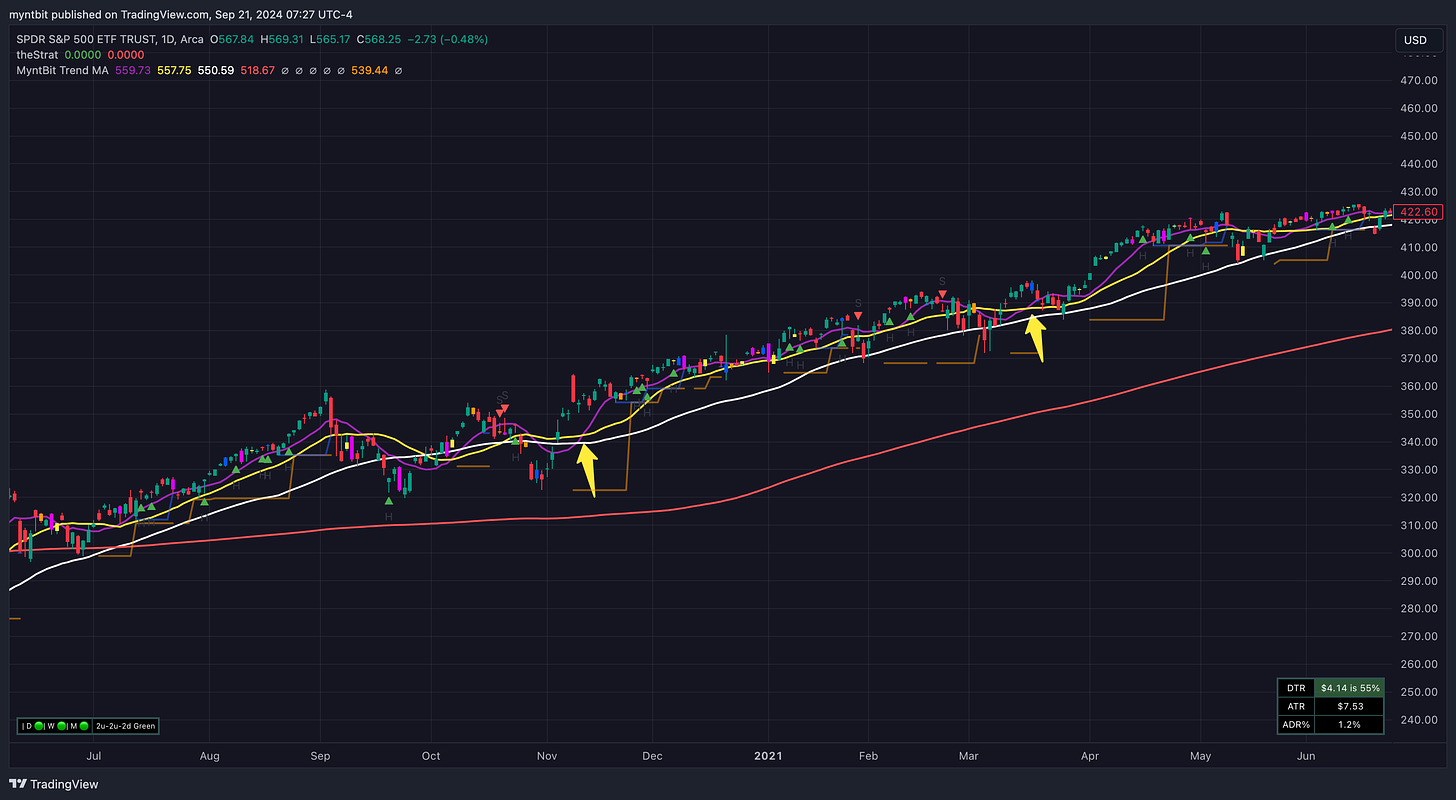
Crossover Strategy: When the 10 EMA crosses above the 21 EMA, it can be an early signal of an uptrend, and vice versa for a downtrend.
Trend Confirmation: Both the 10 and 21 EMAs moving in the same direction signals a strong trend. For example, when the price is above both EMAs, it indicates upward momentum.
50 and 200 SMA: Long-Term Trend Indicators
The 50 and 200-period SMAs are used by traders to gauge the overall long-term direction of the market. They help filter out short-term noise and provide a broader view of market trends.
50 SMA: The 50-period SMA is often regarded as the dividing line between medium-term bullish and bearish trends.
200 SMA: The 200-period SMA is considered one of the most reliable indicators of the long-term trend. It is widely used to signal major shifts in market direction.
Usage:
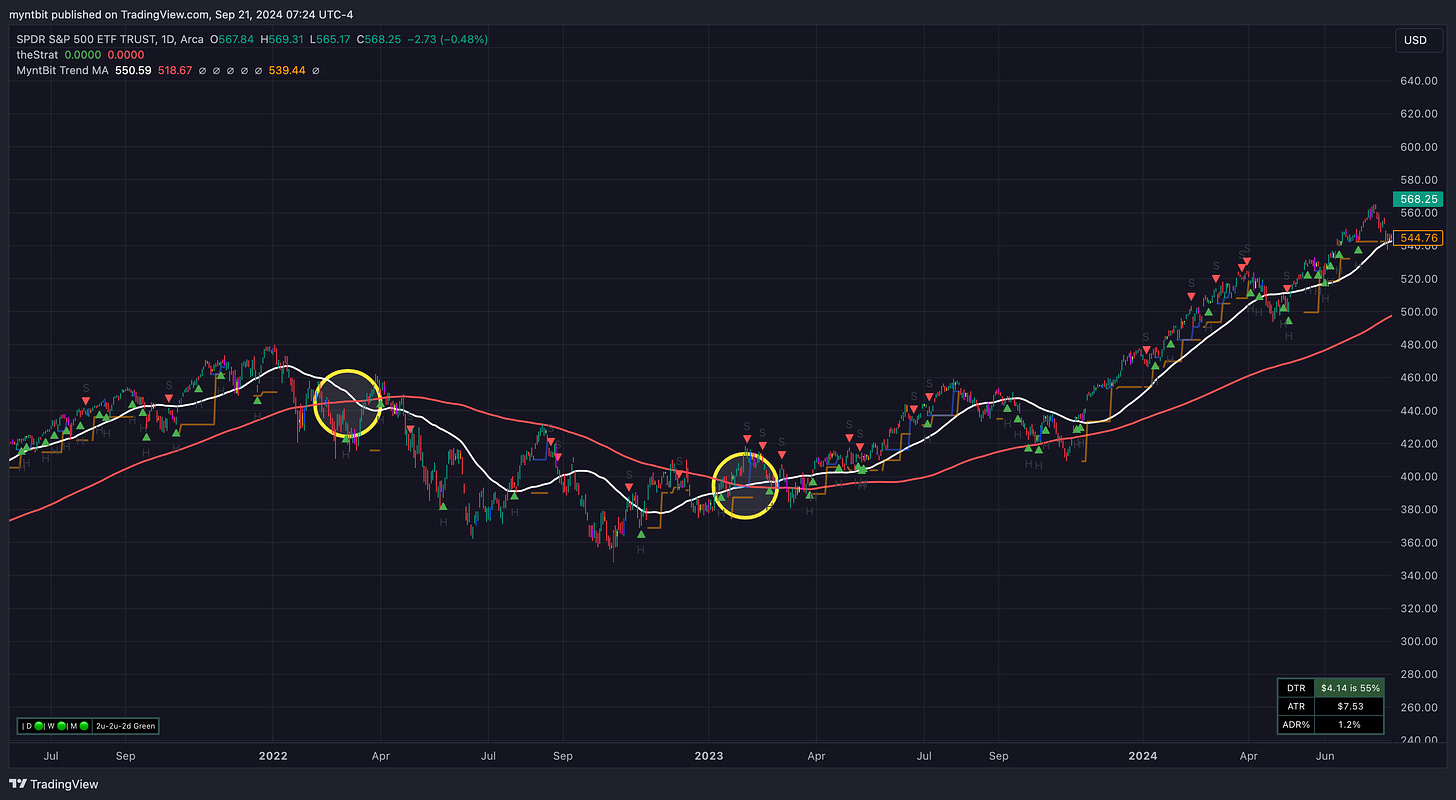
Golden Cross: This occurs when the 50 SMA crosses above the 200 SMA, signaling a major shift to a long-term uptrend. It’s a highly respected bullish signal.
Death Cross: The opposite of the Golden Cross, where the 50 SMA crosses below the 200 SMA, signaling a bearish long-term trend.
Using These Moving Averages Together
Combining the short-term EMAs with the long-term SMAs provides a multi-layered approach to trading. Here’s how traders often use these four moving averages together:
Identifying Short-Term Entry Points:
When the 10 EMA crosses above the 21 EMA, it indicates short-term bullish momentum. This can be a signal to enter a trade, especially if the price is above the 50 and 200 SMAs.
Trend Confirmation with Long-Term Averages:
If the price is above the 50 and 200 SMAs, it suggests the market is in a long-term uptrend. Entering trades when the 10 and 21 EMAs are aligned with this trend increases the probability of success.
Spotting Reversals:
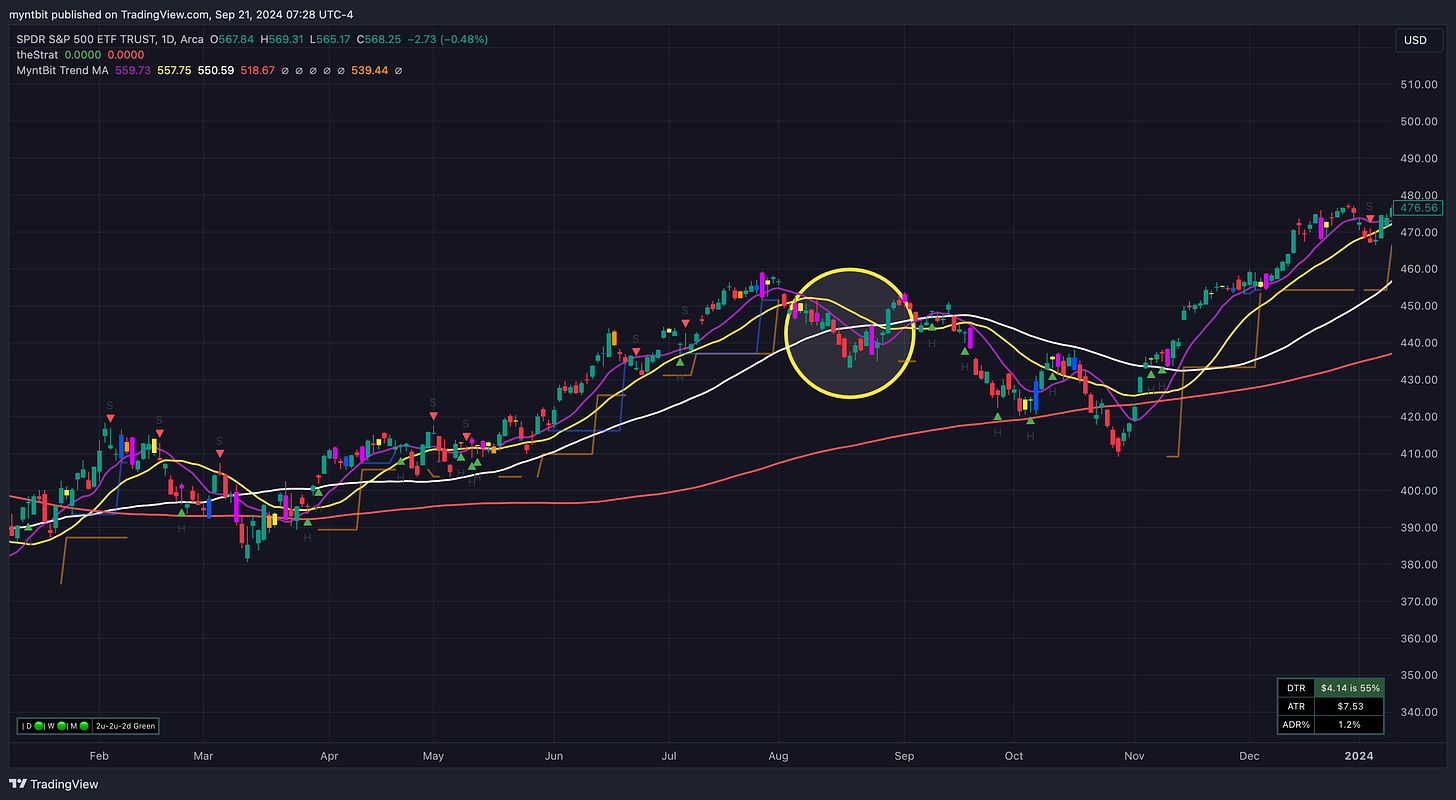
When the 10 and 21 EMAs cross below each other, while the price also breaks below the 50 or 200 SMA, it can indicate a shift from a bullish to a bearish market, providing a signal to exit long positions or enter short trades.
Golden and Death Crosses:
Long-term traders often wait for the 50 SMA to cross the 200 SMA to confirm major trend reversals. A Golden Cross signals long-term bullish strength, while a Death Cross suggests a long-term downtrend.
Example in Action
Let’s say a stock is trading above its 50 and 200 SMAs, indicating a long-term uptrend. The 10 EMA crosses above the 21 EMA, signaling short-term bullish momentum. This could be a good entry point for a long trade. As long as the price stays above the 50 and 200 SMAs and the 10 EMA remains above the 21 EMA, the uptrend is considered intact.
Conversely, if the price breaks below the 50 SMA and the 10 EMA crosses below the 21 EMA, this might be an early warning of a trend reversal, signaling a potential exit.
Moving averages are a powerful tool in technical analysis, offering insights into both short-term momentum and long-term trends. By combining the 10 and 21-period EMAs with the 50 and 200-period SMAs, traders can develop a robust strategy that balances short-term opportunities with long-term market direction. This combination helps traders spot potential entry and exit points while filtering out market noise, making it a popular approach among both novice and experienced traders.

