Market Trader Report V2#14 | Put/Call Ratio & UNH, ZS, DAL, AAPL, JD
MyntBit's Newsletter brings potential setups with a time horizon from days to weeks depending on price action. The following research is based on Fundamentals & Technical Analysis.
What is included in this week's edition?
WEEKLY REVIEW - An overview of current market standing, fundamental matters with implications upon the market, and general sentiment regarding the major US indices.
LOOKING AHEAD - Key takeaways to consider as we look forward to the upcoming trading week.
FUTURES MARKETS - A technical review of the major indices, futures, and commodities that represent the overall health of the market.
STOCKS - Trends, key levels, and trade targets are identified for individual names presenting potential opportunities in the market.
STRATEGY & EDUCATION - Assist traders with developing and implementing more informative trading strategies.
Market Trader by MyntBit
Weekly Review
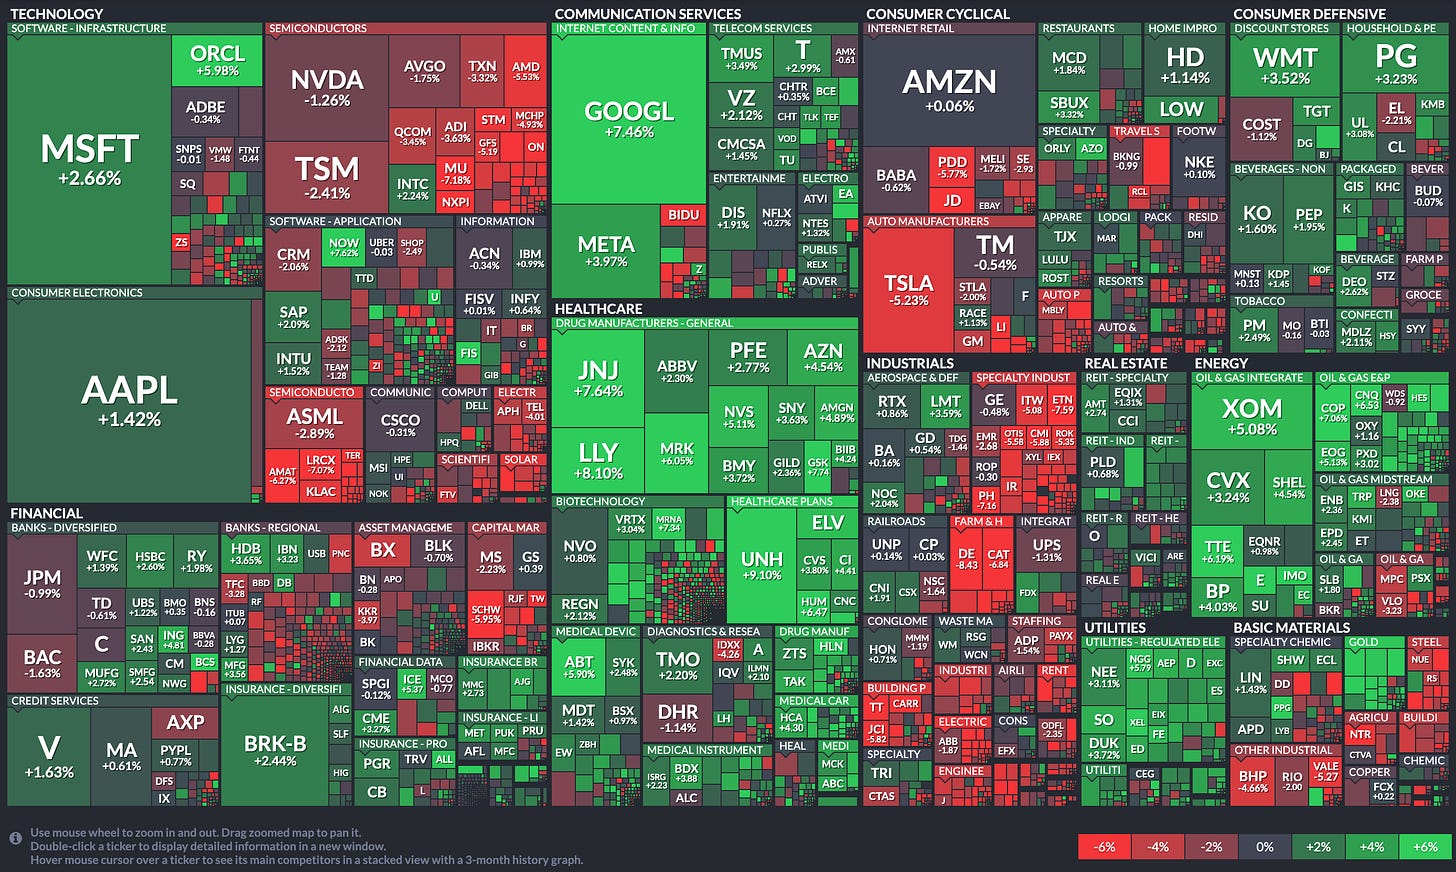
The stock market mostly declined this week due to renewed growth concerns after OPEC+ announced a 1.16 million barrels per day production cut, which sent oil prices up by 6.4%. Weaker-than-expected economic data and concerns raised by JPMorgan Chase CEO Jamie Dimon in his annual shareholder letter about the regional banking crisis also contributed to the decline. Defensive-oriented sectors, including utilities and health care, enjoyed gains, while cyclical sectors, such as industrials, consumer discretionary, and materials, were the biggest losers. The Treasury market remains open until Friday noon, so Thursday's settlement levels are not comparable for weekly yield changes.
Weekly Performance Heatmap
Overall Stock Market Heatmap
Sector Performance
Looking Ahead
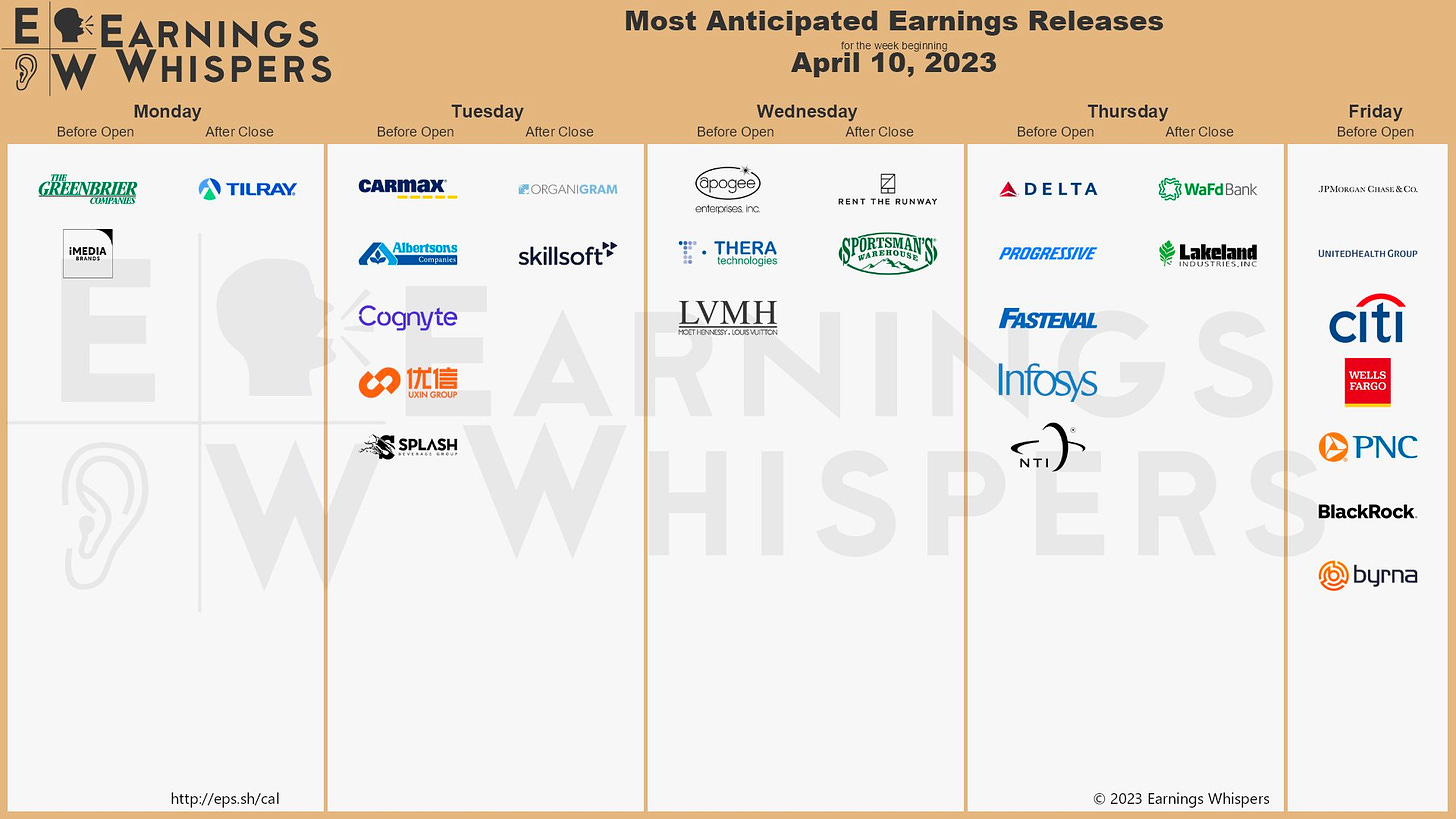
Next week, investors will focus on the U.S. inflation data for March, which is expected to come in at 5.2% year-over-year for the Consumer Price Index (CPI) and 5.6% year-over-year for Core CPI, excluding food and energy prices. Additionally, updates on wholesale inflation data, the University of Michigan Consumer Sentiment Index, China's inflation data, Japan's wholesale inflation data, and retail sales updates will be available. Several Fed officials are scheduled to speak, and the Federal Open Market Committee (FOMC) March 22 meeting minutes will be released. Bank of England (BOE) Governor Andrew Bailey is also set to speak in Washington. Furthermore, the first-quarter earnings season begins, and several major financial institutions will be reporting their earnings.
Earnings Calendar
Economical Events
Economic Calendar
Future & Commodities Markets
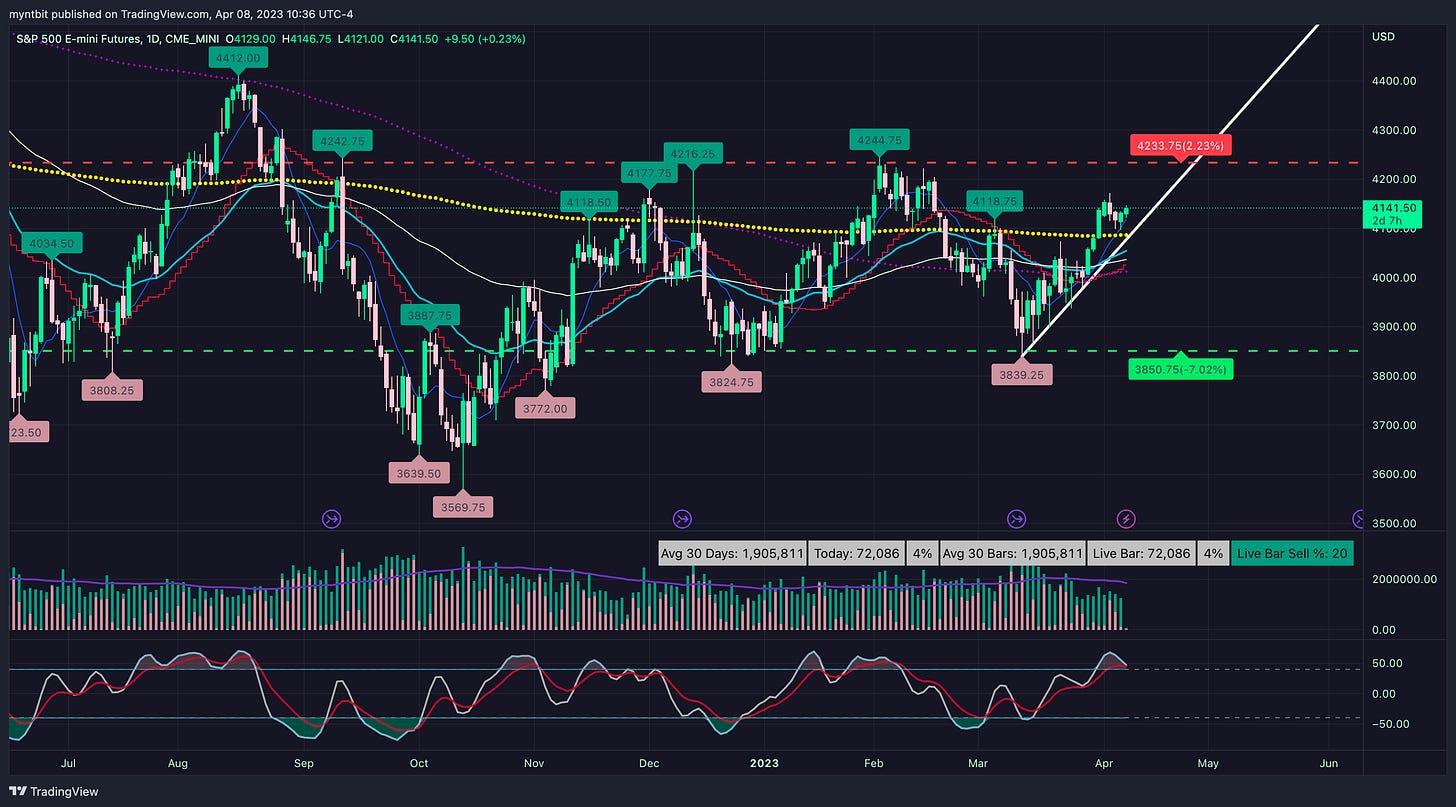
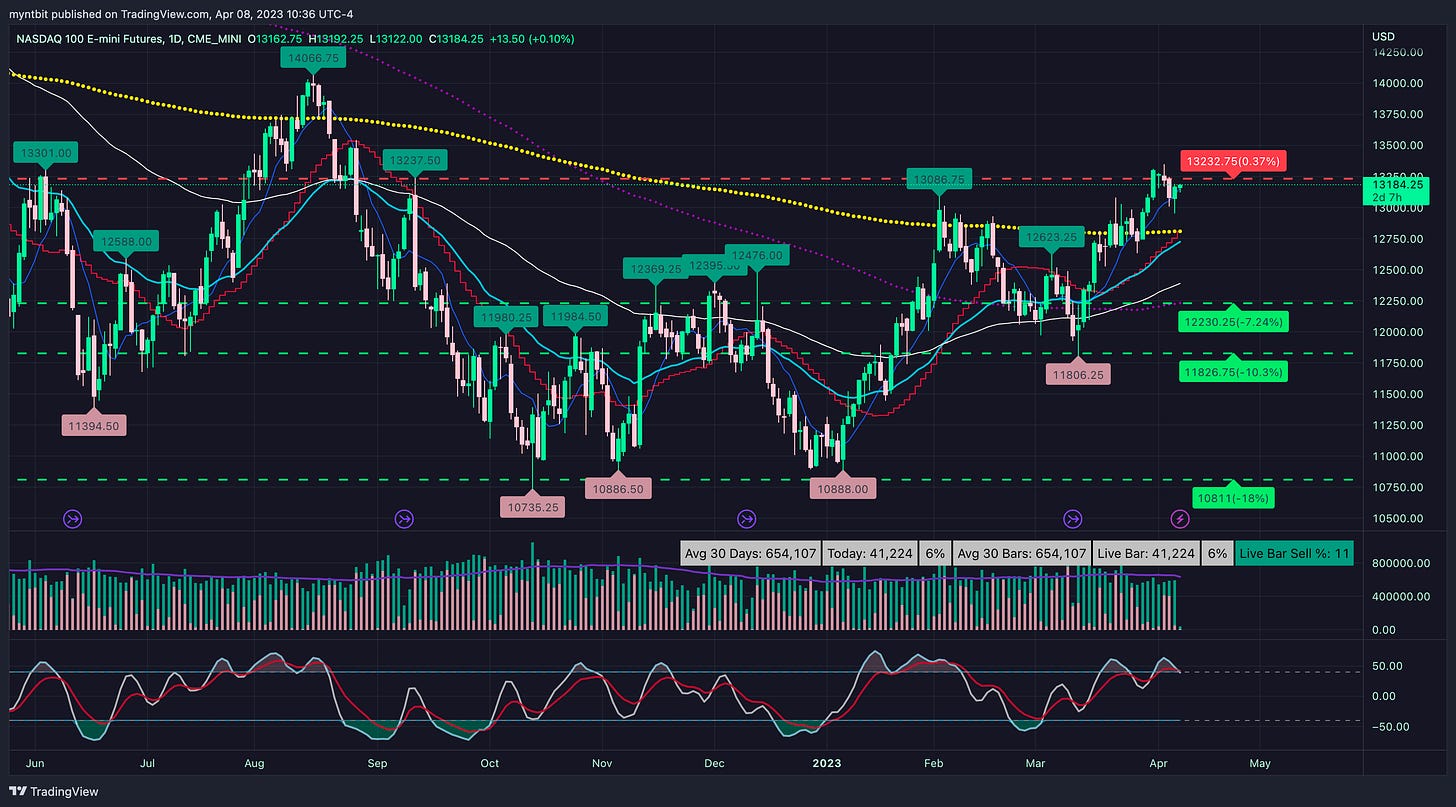
Below are the levels for /ES and /NQ for the upcoming week - updates will be provided in the discord throughout the week.
/ES - Emini S&P 500
Upside: If we hold and stay above the 4130, we could expect to test 4160-4170 and if we manage to break above that, then the next stop is 4200.
Downside: If we fail to hold 4130, then we could go down to retest the 4115-4100 but failed to hold that level as support will open a test of 4080-4050.
/NQ - Emini Nasdaq 100
Upside: If we hold and stay above 13150, then we can test 13250-13350 and the next level up would be 13500.
Downside: If we fail to hold 13150, we could go down 13000 (critical support) and test another critical support at 12850.
Stocks
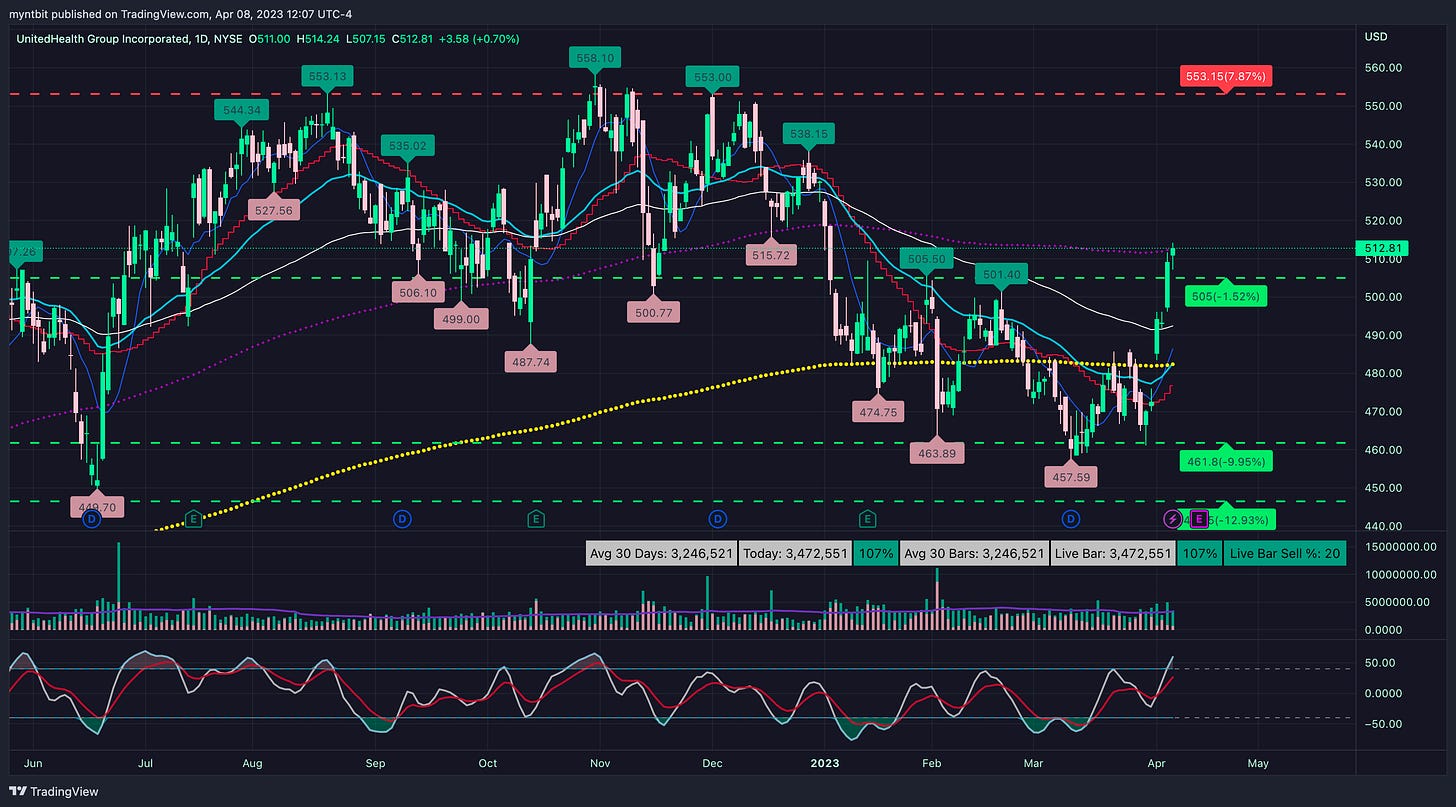
UNH - UnitedHealth Group Inc
Earnings on Friday, April 14
UNH has issued earnings guidance for FY 2023. EPS is estimated in the range of 24.40 to 24.90, which would be an 11% increase from the prior year. Revenue is estimated in the range of 357.0 B to 360.0 B, which would be an 11% increase from the prior year.
Currently, UNH is rejecting 200 SMA. Also, FVG at 516.18 is serving as a resistance.
Resistance is 524.46, and 537.75
Support is at 505.72, 501.37, 493.56, 483.94
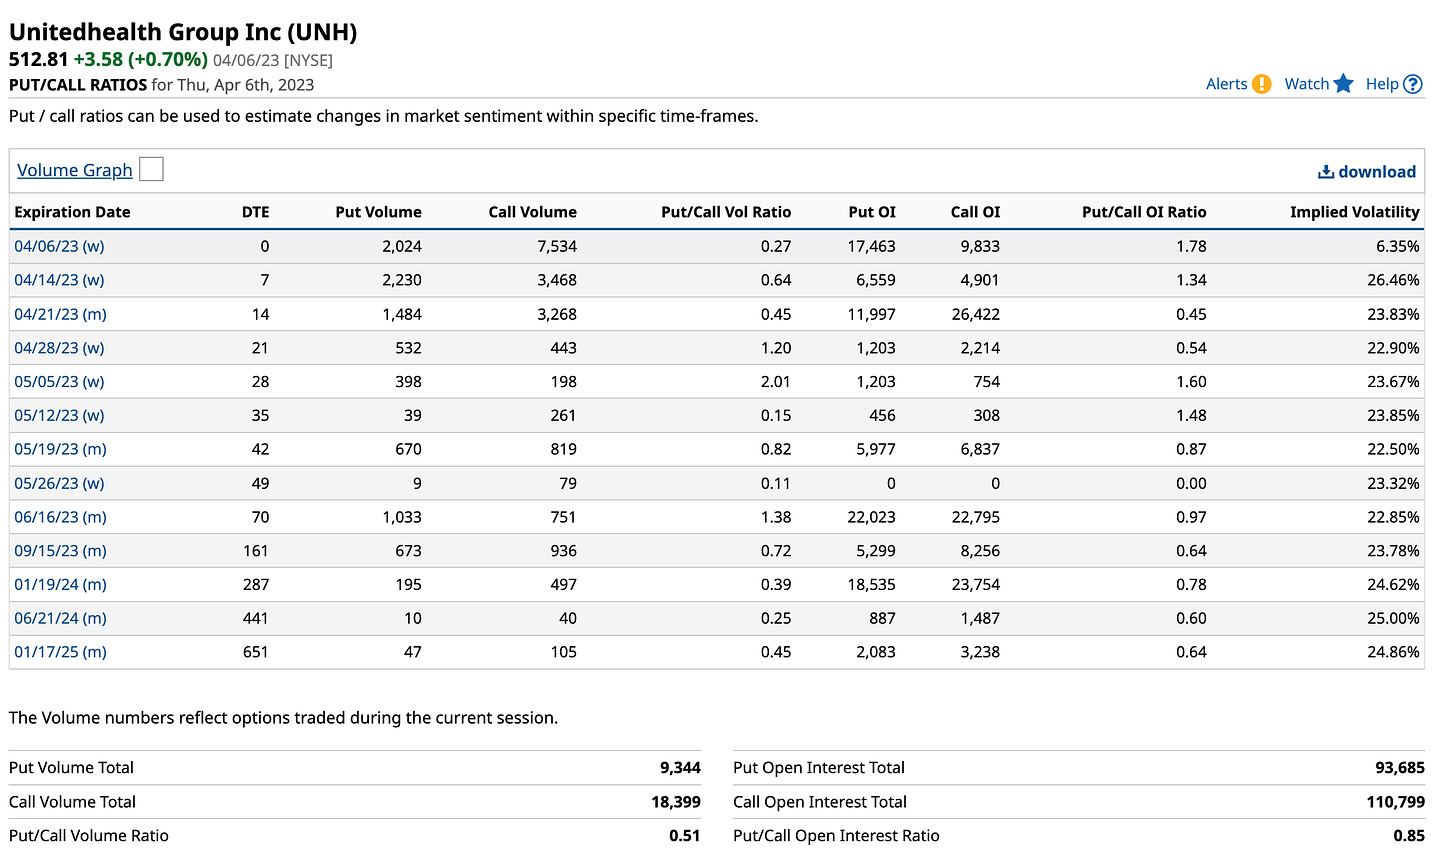
Options flow for UNH:
ZS - Zscaler Inc
Earnings Expected May 24 - May 26
ZS has issued earnings guidance for Q3 2023. EPS is estimated at 0.39, which would be a 129% increase from the same period last year. Revenue is estimated in the range of 396.0 M to 398.0 M, which would be a 38% increase from the same period last year.
Previous earnings history:
ZS options flow:
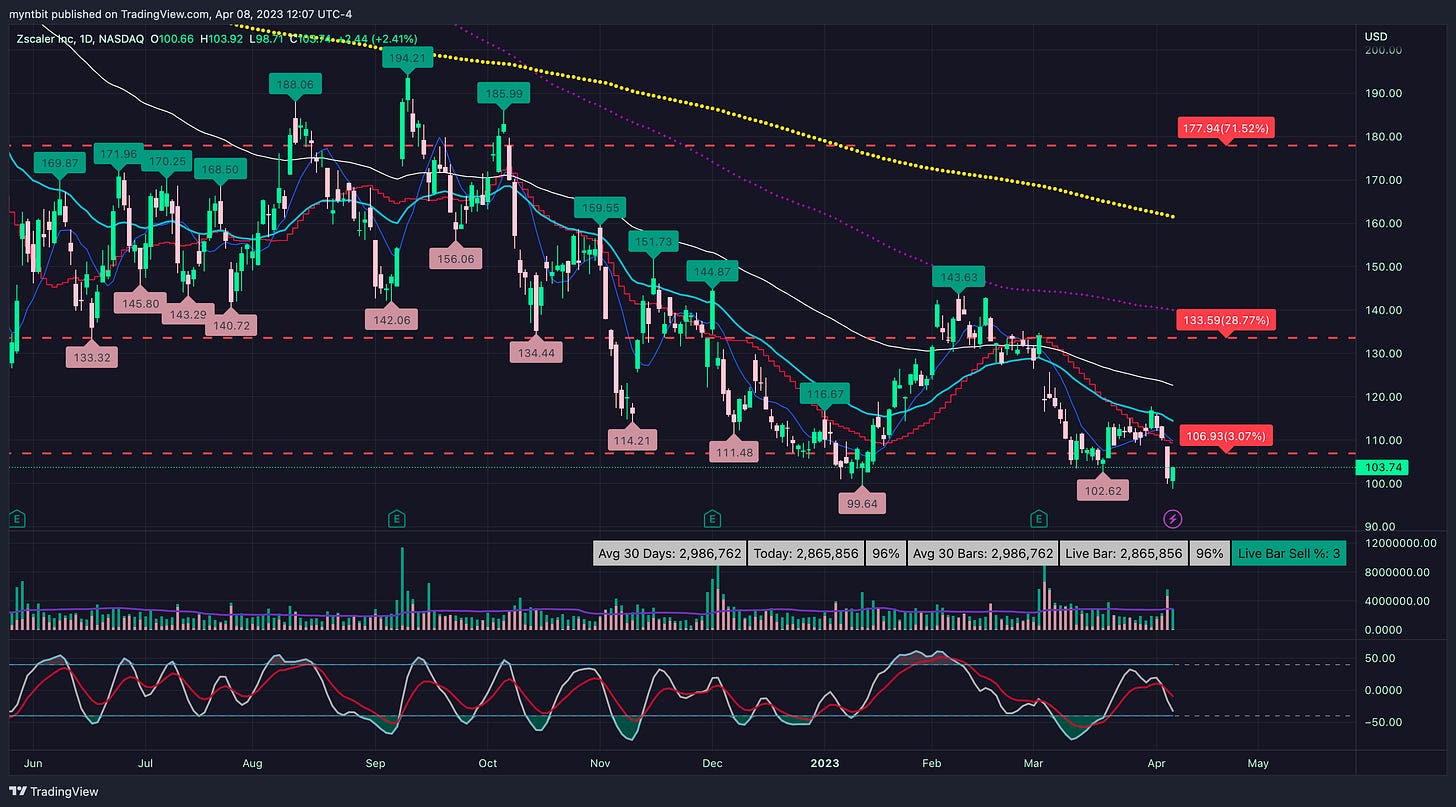
Support for ZS: 99.77 (same support from June 2022, and April 2020). If it breaks this support, the next support is 85.59 and the gap fill at 78.20
Resistance: 103.83 (support from 03/20/2023), 105.88, 108.71, gap fill at 110
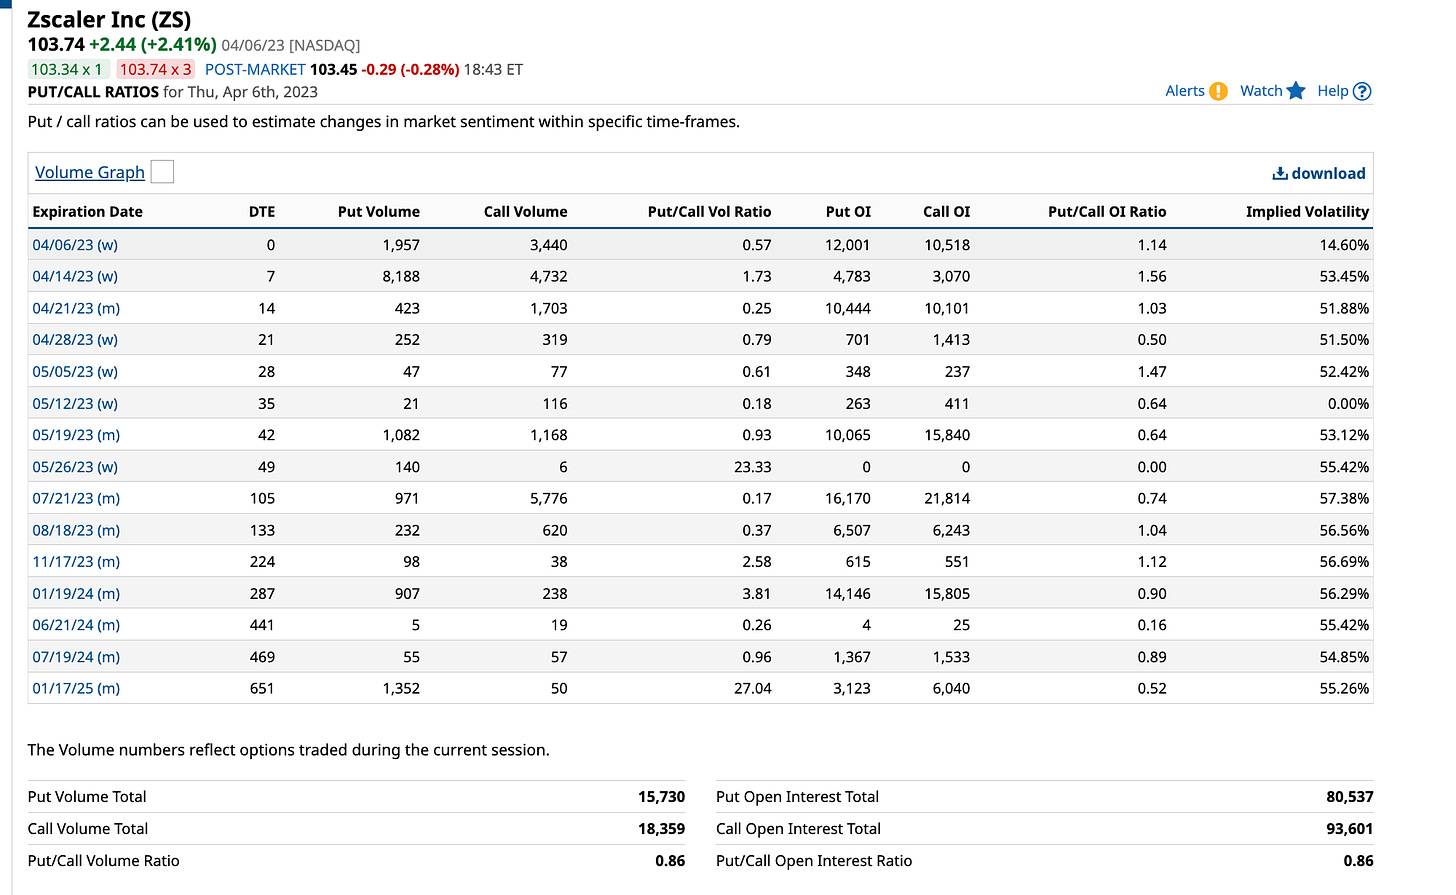
ZS Put/Call ratio:
DAL - Delta Air Lines Inc
Earnings on Thursday, April 13
DAL has issued earnings guidance for Q1 2023. EPS estimate in the range of 0.15 to 0.40. Revenue Growth is estimated in the range of 14.0% to 17.0%. Operating Margin estimate in the range of 4.0% to 6.0%.
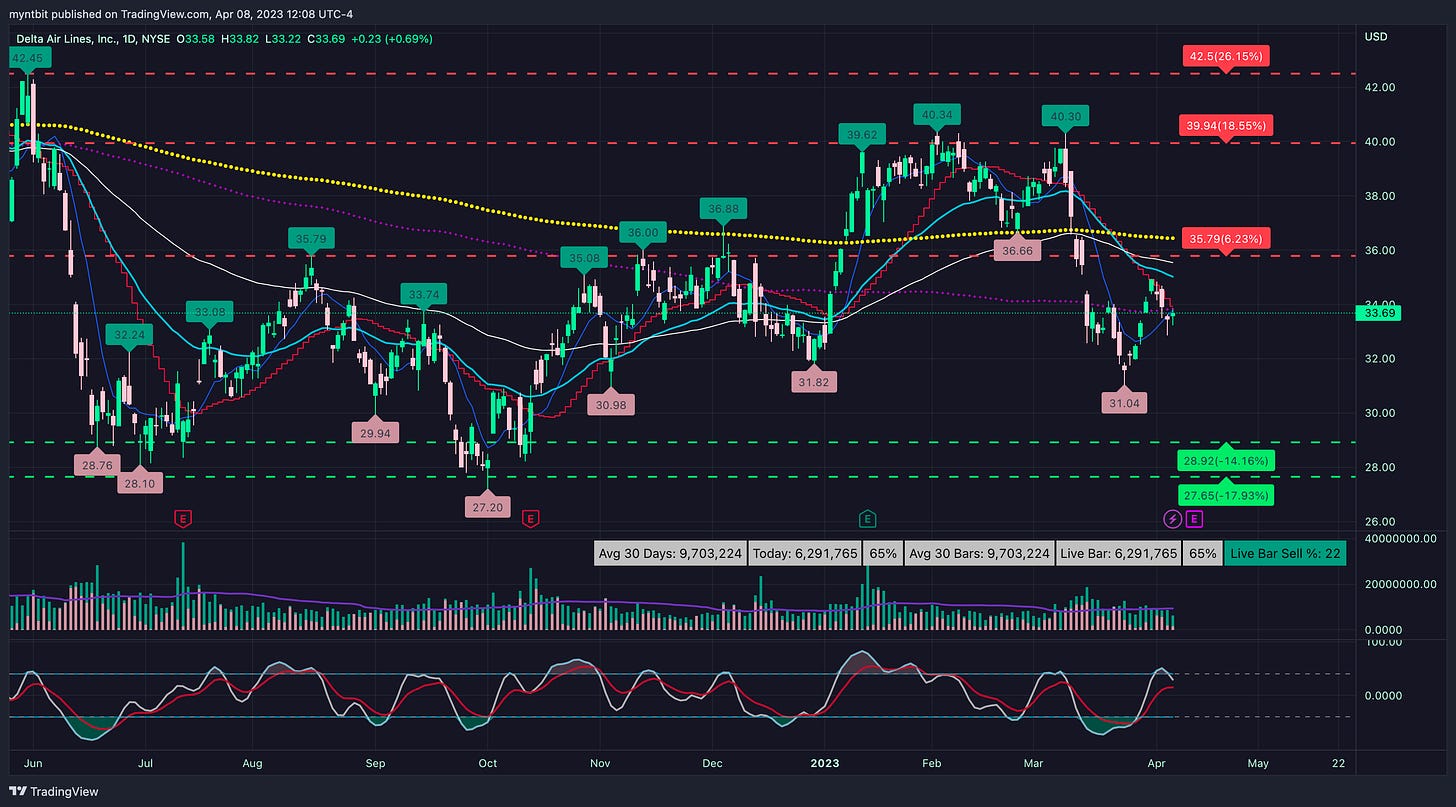
Support: 32.03, 30.94, 29.78, 28.20, 27.17
Resistance: 200 SMA is currently serving as resistance (33.80), 34.63, 35.36 (200 EMA)
AAPL - Apple Inc
AAPL is currently a weird one. It is overvalued but at the same time, nothing is stopping this train. So, here are the levels for it.
Support: 161.27, 158.57, 154.33, 150, 149.58
Resistance:165.12, 170.98
Below are the analysts' ratings for AAPL:
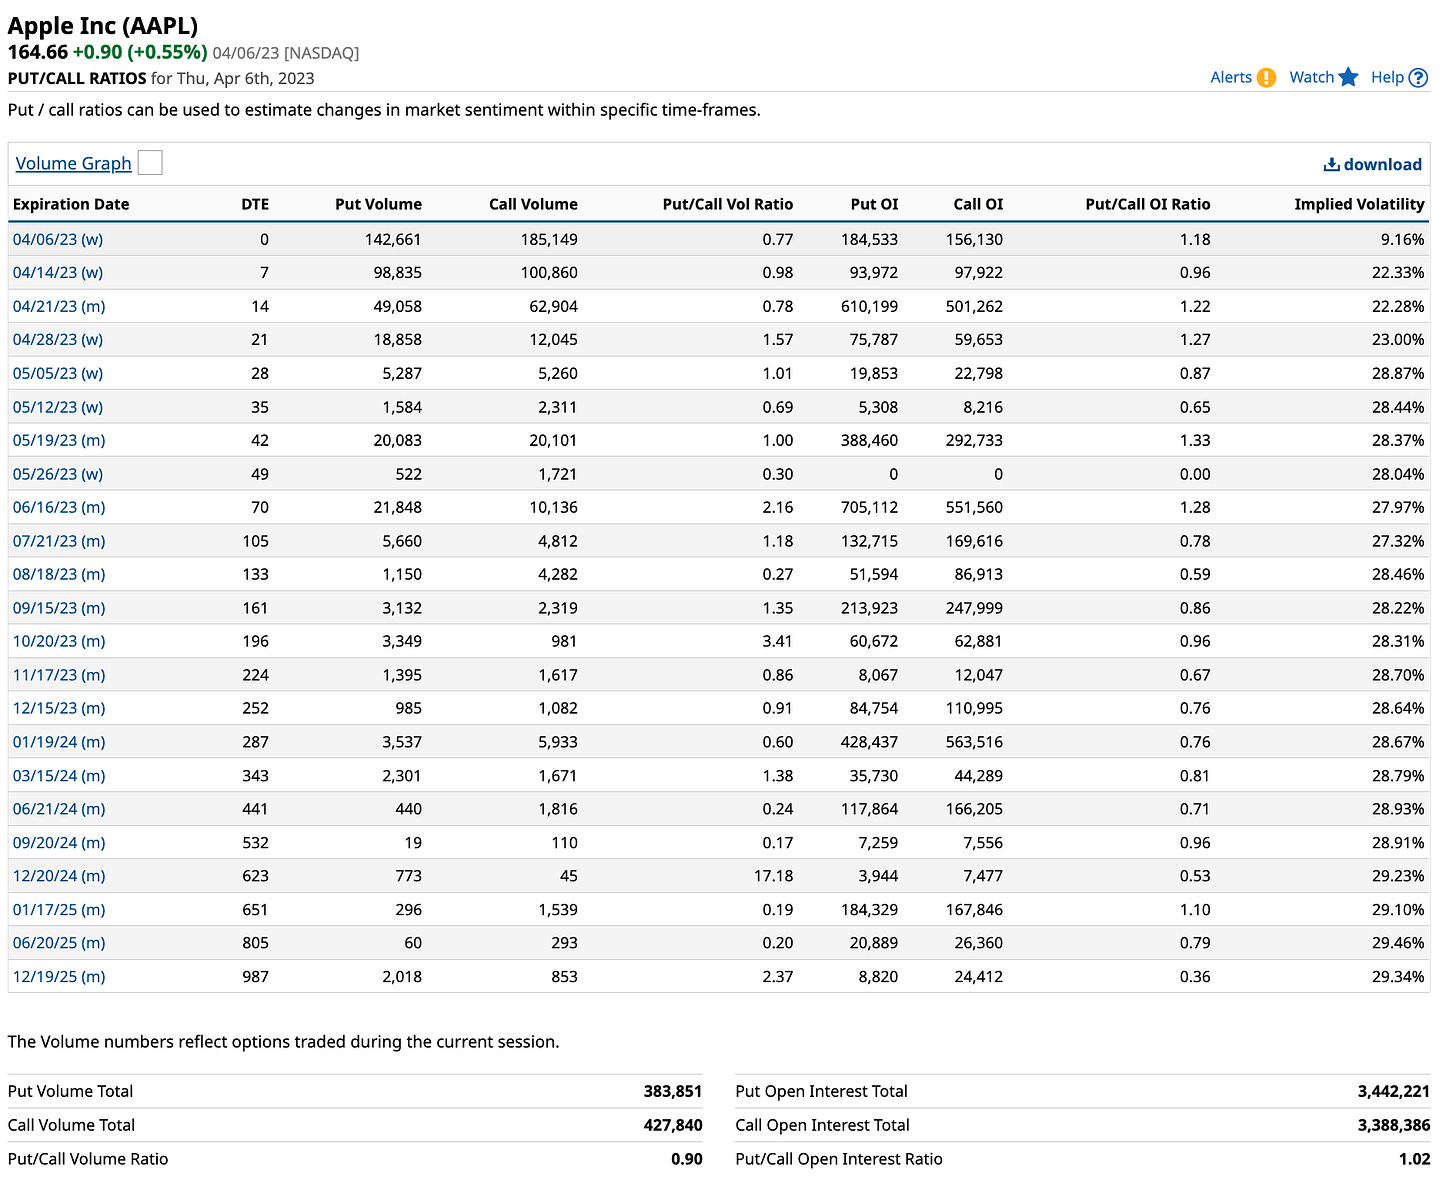
AAPL's Put/Call ratios:
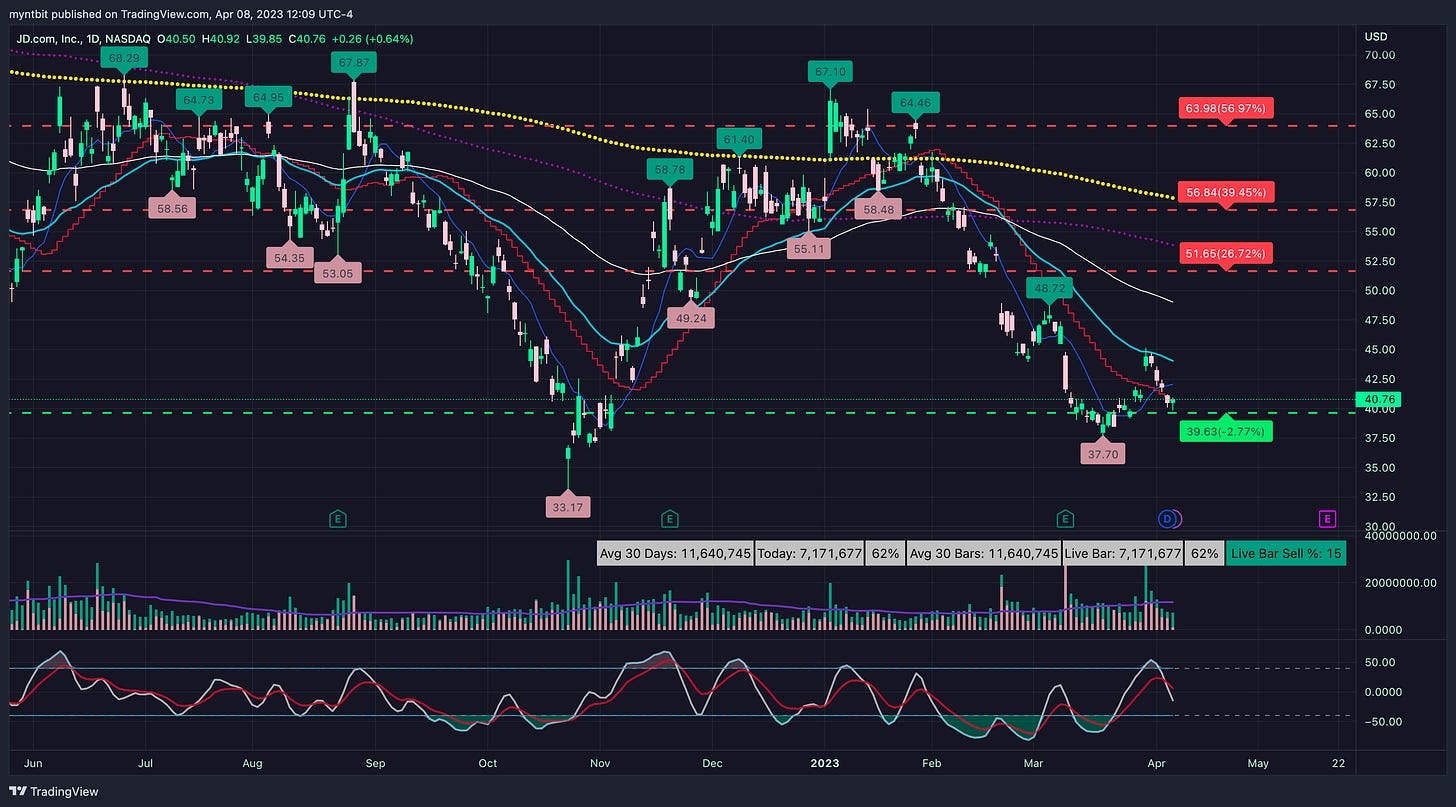
JD - JD.Com Inc
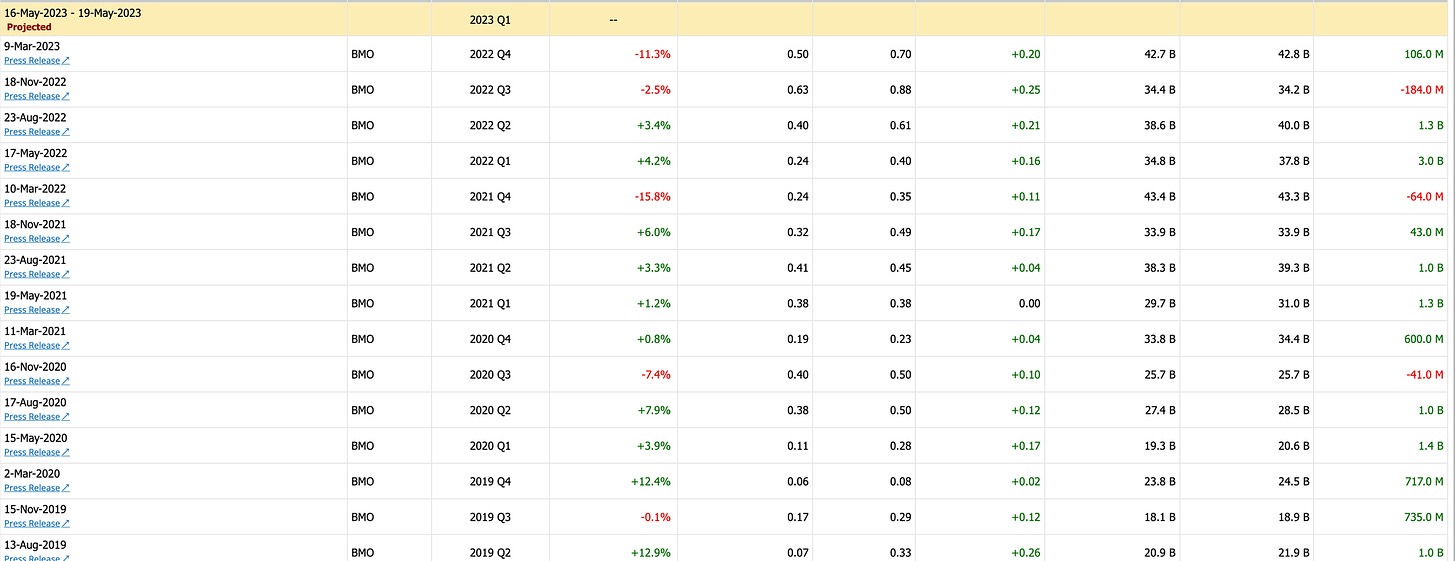
Earnings Expected May 16 - May 19
JD.com, one of the largest e-commerce companies in China, is expected to have an EPS of $0.42 and revenue of $167.88 billion for the upcoming quarter. This information suggests that JD.com is likely to continue its strong financial performance in the near future.
Support Levels: 39.74, 38.18, 37.65, 33.04, 32.18
Resistance Levels: 41.35, 42.02, 43.53, 45.40
👇 Updates for the stocks & futures will be provided in the discord throughout the week (link is below)
Strategy & Education
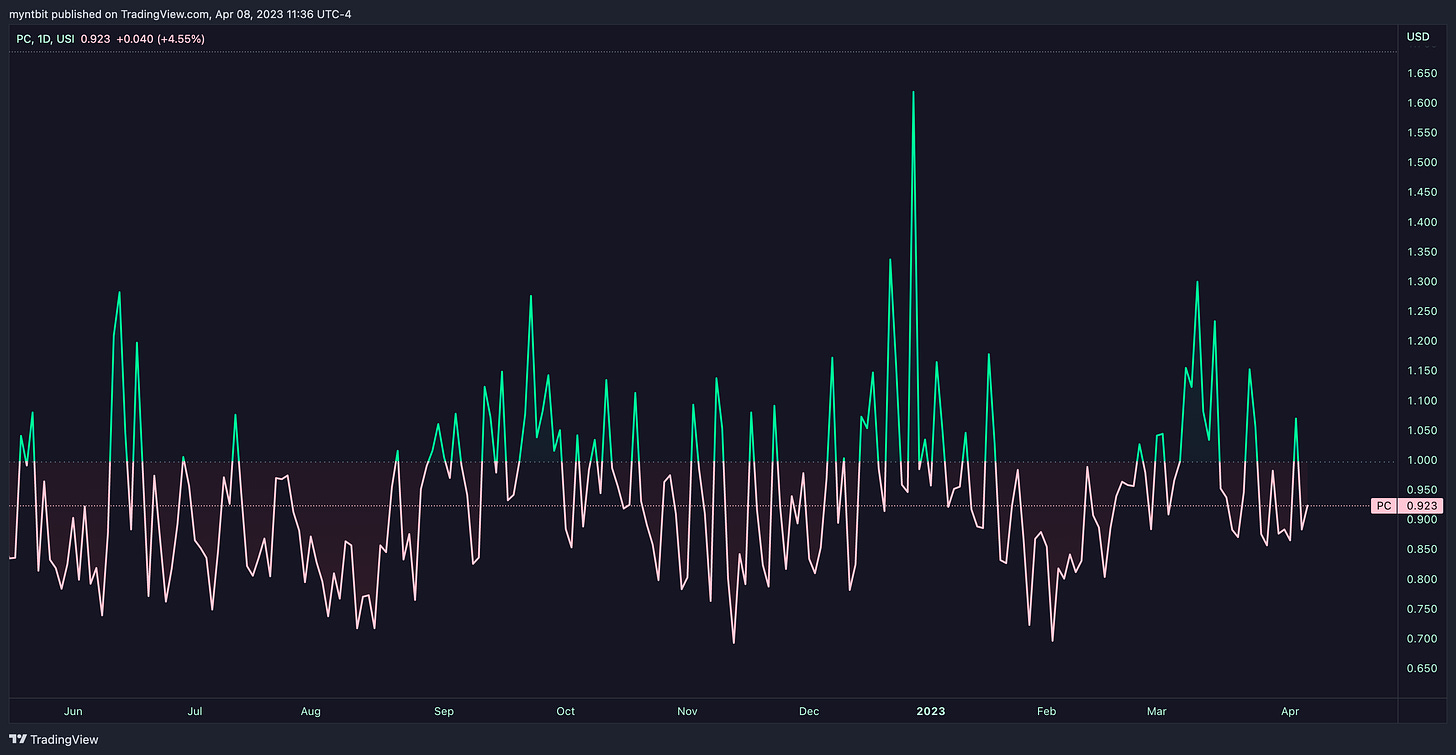
Put/Call Ratio
Put/call ratios are a popular tool for forecasting market direction. The ratio is calculated by dividing the number of outstanding put options by the number of outstanding call options. If the put/call ratio is above 1, it indicates that investors are more bearish and buying more puts than calls. Conversely, if the put/call ratio is below 1, it suggests that investors are more bullish and buying more calls than puts.
❗ Using P/C Ratios in Tradingview:
PC - PUT/CALL RATIO
PCC - PUT/CALL RATIO (EQUITIES+INDICIES) - CBOE
PCE - PUT/CALL RATIO - EQUITIES
Market analysts use put/call ratios to gauge investor sentiment and predict future market movements. A high put/call ratio suggests that investors are worried about a decline in the market and are buying puts to hedge their positions. In contrast, a low put/call ratio indicates that investors are optimistic about the market and are buying calls to profit from a potential increase in prices.
The put/call ratio can be used as part of a broader investment strategy to make more informed trading decisions. One potential strategy is to use the put/call ratio to identify market extremes and take contrarian positions. For example, if the put/call ratio is very high, indicating that investors are extremely bearish, a contrarian trader may take a long position, betting that the market will rebound.
Another strategy is to use the put/call ratio to identify trends in investor sentiment over time. For example, if the put/call ratio has been steadily increasing, it may suggest that investors are becoming more bearish and that a market decline could be imminent. Conversely, if the put/call ratio has been decreasing, it may indicate that investors are becoming more bullish and that the market could be poised for a rally.
While put/call ratios can provide valuable insights into investor sentiment, they are not foolproof indicators of market direction. The ratio can be affected by a number of factors, including changes in market volatility, shifts in options market trading strategies, and changes in interest rates. It is important to note that while the put/call ratio can provide valuable insights, it should not be used as the sole basis for making trading decisions. Other factors, such as technical analysis, fundamental analysis, and market news, should also be considered. Additionally, traders should always use risk management strategies, such as stop-loss orders, to protect against unexpected market movements.
Disclaimer: This newsletter is not trading or investment advice, but for general informational purposes only. This newsletter represents our personal opinions that we share publicly for educational purposes. Futures, stocks, and bonds trading of any kind involves a lot of risks. No guarantee of any profit whatsoever is made. In fact, you may lose everything you have. So be very careful. We guarantee no profit whatsoever, You assume the entire cost and risk of any trading or investing activities you choose to undertake. You are solely responsible for making your own investment decisions. Owners/authors of this newsletter, its representatives, its principals, its moderators, and its members, are NOT registered as securities broker-dealers or investment advisors either with the U.S. Securities and Exchange Commission, CFTC, or with any other securities/regulatory authority. Consult with a registered investment advisor, broker-dealer, and/or financial advisor. By reading and using this newsletter or any of my publications, you are agreeing to these terms. Any screenshots used here are courtesy of ForexFactory, Earnings Whispers, Finviz, Market Chameleon, Tradytics, and/or Tradingview. We are just end-users with no affiliations with them.

