Market Trader Edition No. 17
Market Trader's goal is to bring you potential swing setups with a time horizon from days to months depending on price action. The stock selection is based on Fundamentals & Technical Analysis.
What is included in this week's edition?
WEEKLY REVIEW - An overview of current market standing, fundamental matters with implications upon the market, and general sentiment regarding the major US indices.
FUTURES & COMMODITIES MARKETS - A technical review of the major indices, futures, and commodities that represent the overall health of the market.
SPDR SECTORS & ETFs - An in-depth review of the SPDR sectors with keynotes on market strength, opportunities, and relative rotation.
STOCKS TO WATCH - Trends, key levels, and trade targets are identified for individual names presenting potential opportunities in the market.
LOOKING AHEAD - Key takeaways to be mindful of as we look forward to the upcoming trading week.
Market Trader by MyntBit
Weekly Review
It was an overall disappointing week for a market that is still looking for a Santa Claus rally to end the year. Tax-loss selling efforts were likely part of this week's losses, but sentiment overall soured because of a growing belief that 2023 earnings estimates are too high and will be subject to downward revisions in coming weeks and months as the economic environment deteriorates. The S&P 500, which touched 4,100 last Tuesday, was drawn to the 3,800 level all week, which proved to be a key support area.
Things got started on a weaker note as market participants digested a weaker-than-expected NAHB Housing Market Index report for December on Monday. Participants were also reacting to a Bloomberg report highlighting a rebalancing disposition that will presumably favor bonds in the last few weeks of the year.
To be fair, price action in the bond market this week did not corroborate that article. The 10-yr note yield rose 27 basis points to 3.75% and the 2-yr note yield rose 11 basis points to 4.31%.
Most of the action in the Treasury market was precipitated by a surprise move from the Bank of Japan (BOJ) on Tuesday. The BOJ announced a surprise tweak to its yield curve control (YCC) policy to allow the 10-yr JGB yield to move +/- 50 basis points from 0.00% versus its prior band of +/- 25 basis points as part of an effort "to improve market functioning."
This announcement, which came in conjunction with the BOJ's decision to leave its benchmark rate unchanged at -0.1%, also caused some upheaval for the Nikkei (-2.5%) on Tuesday and the currency market in addition to sovereign bond markets. The yen surged as much as 4.0% against the dollar.
Market participants also had to deal with some disappointing housing data before Tuesday's open, namely an 11.2% month-over-month decline in November building permits (a leading indicator) to a seasonally adjusted annual rate of 1.342 million (Briefing.com consensus 1.480 million). Single-unit permits were flat to down in every region.
The S&P 500 dropped below 3,800, scraping 3,795 at Tuesday's low before buyers showed up for a small rebound effort that ultimately left the main indices with modest gains.
The impetus for the reversal was the weakness itself. The major indices were in a short-term oversold position. At their lows Tuesday morning, the Nasdaq Composite and S&P 500 were down 9.7% and 7.5%, respectively, from their highs last week. That oversold posture triggered some speculative buying interest rooted in a belief that the market was due for a bounce.
Things really took off Wednesday when some well-received earnings reports from Dow component Nike (NKE) and leading transport company FedEx (FDX) triggered some decent buying interest.
Market participants also digested some better-than-expected consumer confidence data for December, which was another support factor for the broader market. That report overshadowed a weaker than expected existing home sales report for November that was released at the same time.
Unfortunately, the rebound move soured promptly on Thursday following some disappointing earnings results and commentary from Micron (MU) and CarMax (KMX), a dour Leading Economic Indicators report, and some cautious-sounding remarks from influential hedge fund manager David Tepper on the market's prospects.
Mr. Tepper said he is leaning short the equity markets as he expects the Fed and other central banks to keep tightening and for rates to remain high for a while, making it "difficult for things to go up." His comments resonated with market participants who recalled the hugely successful "Tepper Bottom" call he made in March 2009.
The resulting retreat was broad in nature with the major indices moving noticeably lower right out of the gate, dealing as well with rate hike concerns after the third estimate for Q3 GDP showed an upward revision to 3.2% from 2.9%. The Nasdaq, S&P 500, and Dow were down 3.7%, 2.9%, and 2.4%, respectively, at Thursday's lows.
The S&P 500 was stuck below the 3,800 level and Tuesday's low (3,795) for most of the session before the main indices managed to pare some of their losses in the afternoon trade. There was no specific news catalyst to account for the bounce, which appeared to be driven by some speculative bargain hunting interest following the early washout.
Friday's session also started on a downbeat note after the November Personal Income and Spending Report showed no growth in real spending and PCE and core-PCE inflation rates that are still too high on a year-over-year basis (5.5% and 4.7%, respectively) for the Fed's liking.
This report meshed with a Durable Goods Orders Report for November that was weaker than expected and was subsequently followed by economic data at 10:00 a.m. ET that showed new home sales were stronger than expected in November and that easing inflation pressures helped boost consumer sentiment in December.
Once again, the S&P 500 slipped below the 3,800 level, but soon found support as the new home sales and consumer sentiment data bolstered investor sentiment and spurred some bargain hunting interest. The major indices finished modestly higher on Friday, taking a positive first step during the Santa Claus rally period (last five trading days of the year plus the first two trading sessions of the new year).
Separately, the week concluded with the House passing the $1.7 trillion government funding bill after the Senate passed it, leaving it to be signed by the president early next week.
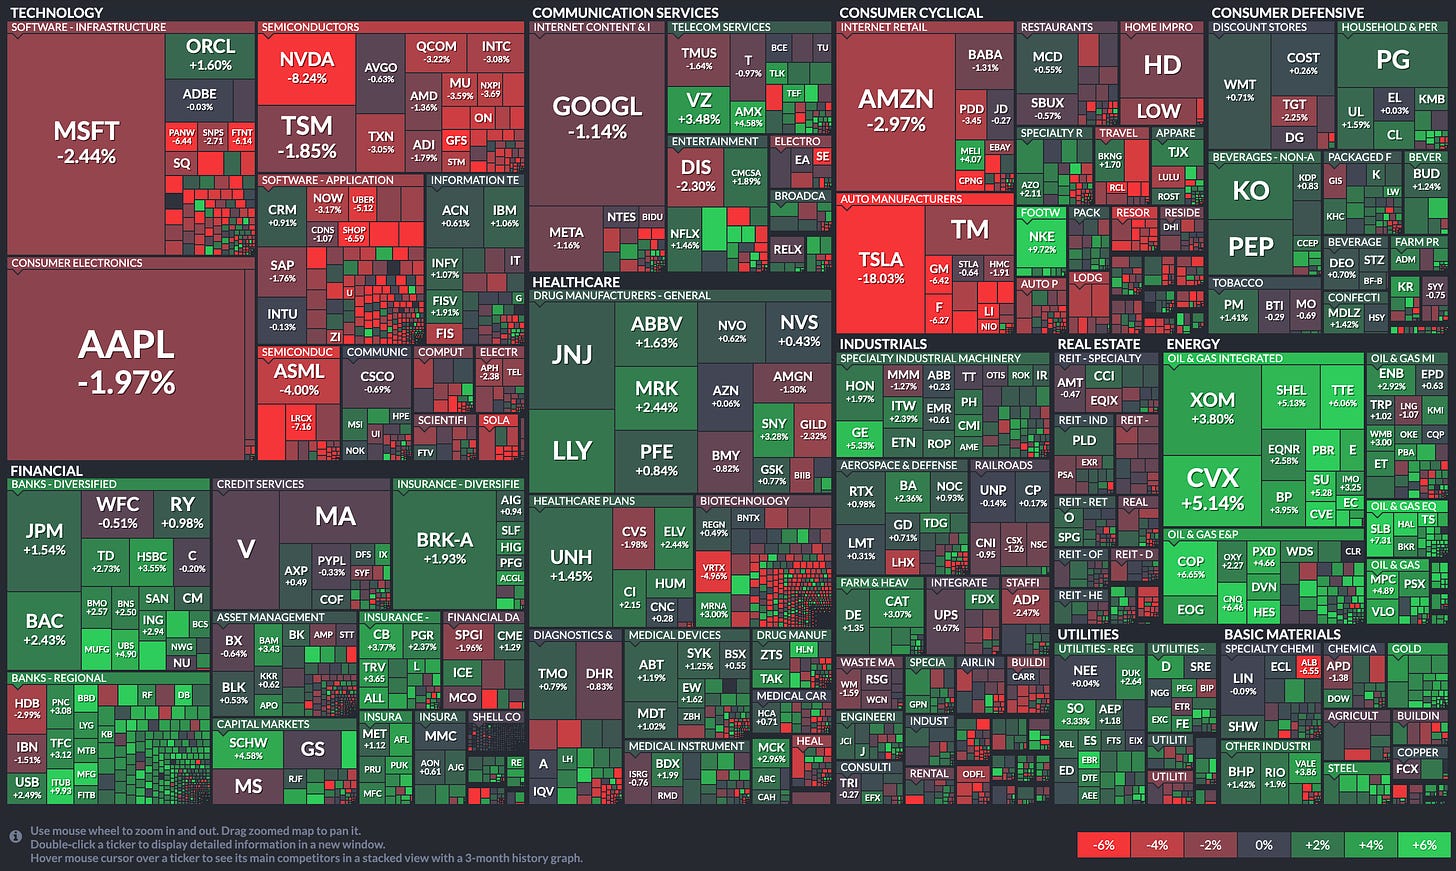
Sector performance this week overall was mixed. Six sectors finished higher and five sectors finished lower. The best performing sectors were energy (+4.4%), utilities (+1.4%), financials (+1.4%), and consumer staples (+1.0%). The weakest links this week were the consumer discretionary (-3.1%) and information technology (-2.0%) sectors, which were dragged down by their mega cap components. The Vanguard Mega Cap Growth ETF (MGK) declined 2.1% for the week.
Source: briefing.com
Market Heatmap
Sector Heatmap
Future & Commodities Markets
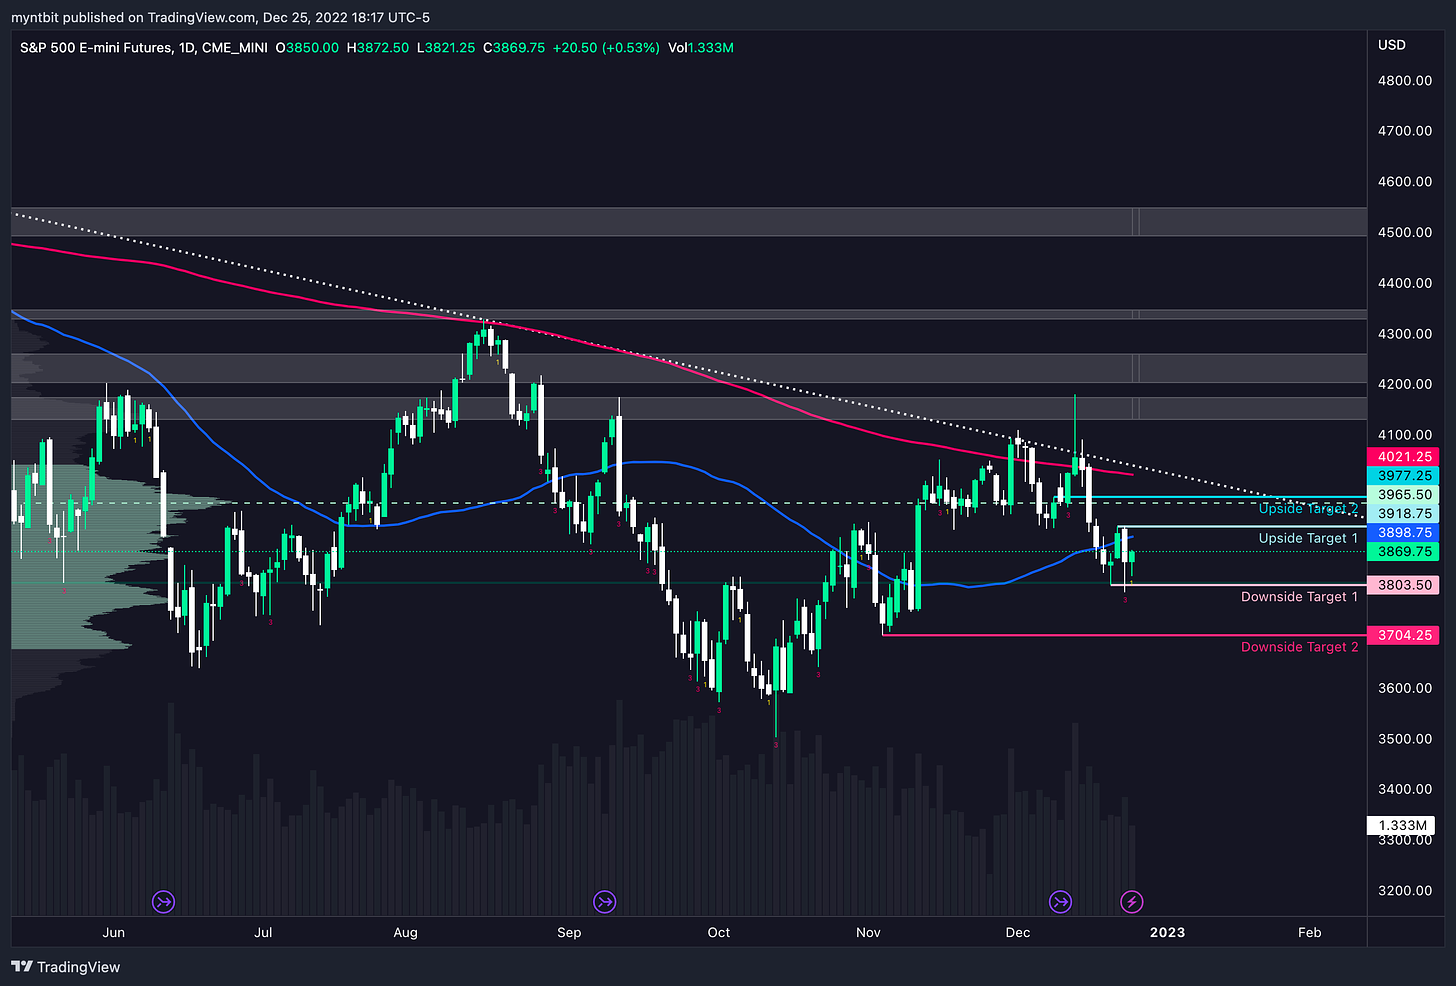
ES - Emini S&P 500
On a daily, looks like a Head & Shoulder pattern with rejection off of the trendline. There is a gap that needs to be filled at 3750 from the Nov CPI data.
Moving Averages: On Daily, 200-day SMA at 4021.25 and 50 SMA at 3898.75.
The Strat: Weekly is 3-2d and Daily with a 1 inside bar.
Upside: 3918.75, 3977.25
Downside: 3803.50, 3660.25
🟡 ES Trend Indicator
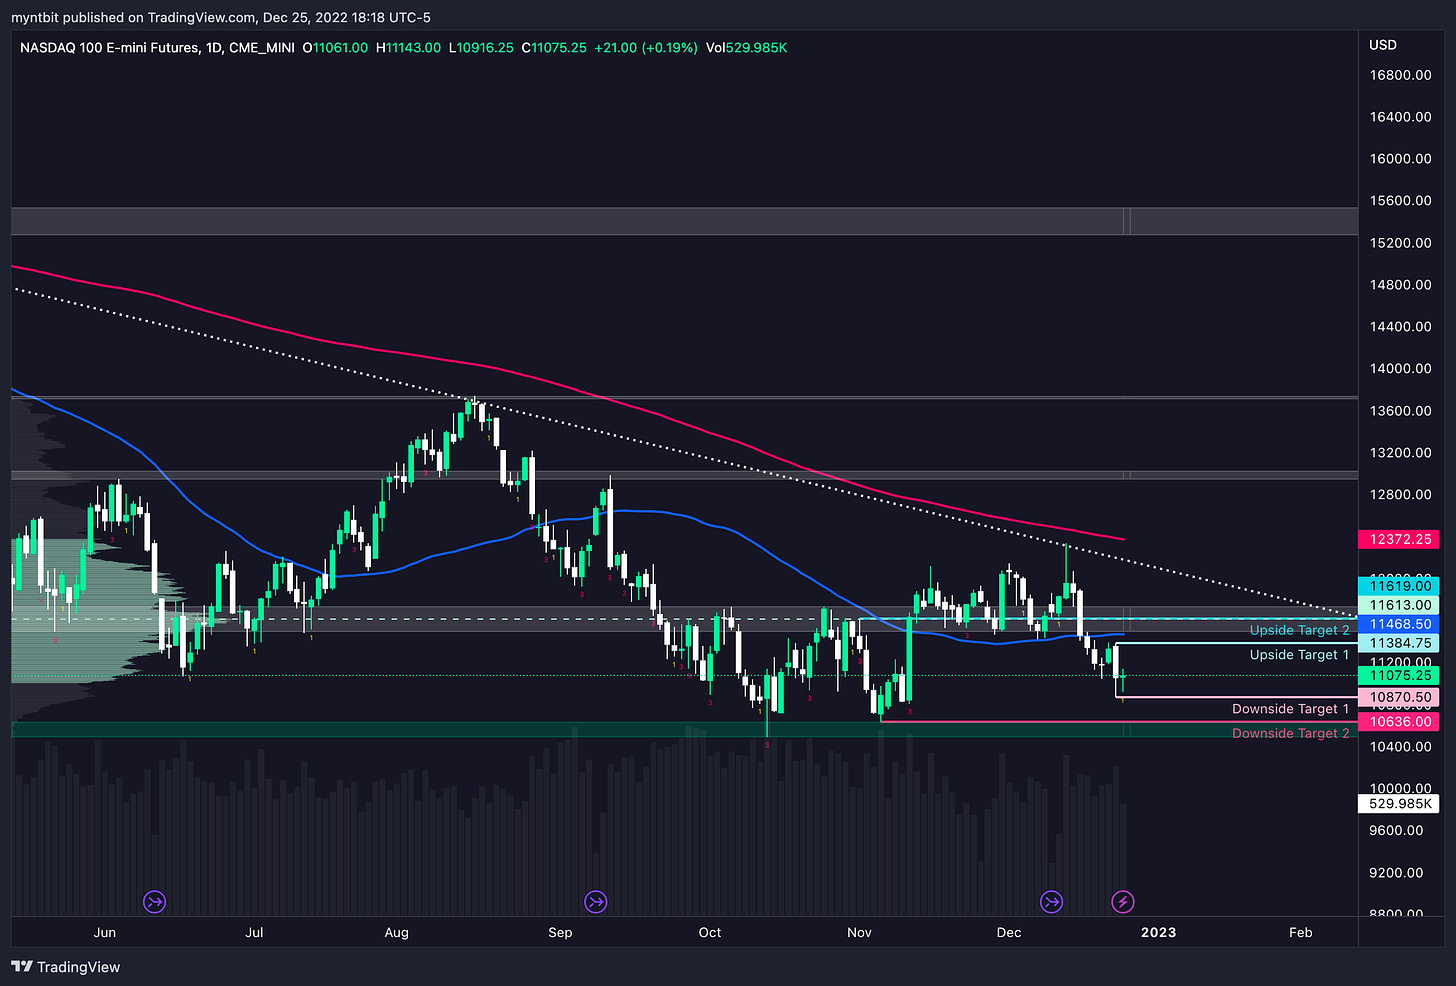
NQ - Emini Nasdaq 100
On a daily, clear rejection of the trendline, and now a trendline from the bottom of Oct acting as support. Also just under 50 SMA and inside a consolidation zone.
Moving Averages: On Daily, 200-day SMA at 12372.25 and 50 SMA at 11468.50.
The Strat: Weekly is 3-2d and Daily with a 1 inside bar.
Upside: 11384.75, 11616.75
Downside: 10870.50, 10636.00
🔴 NQ Trend Indicator
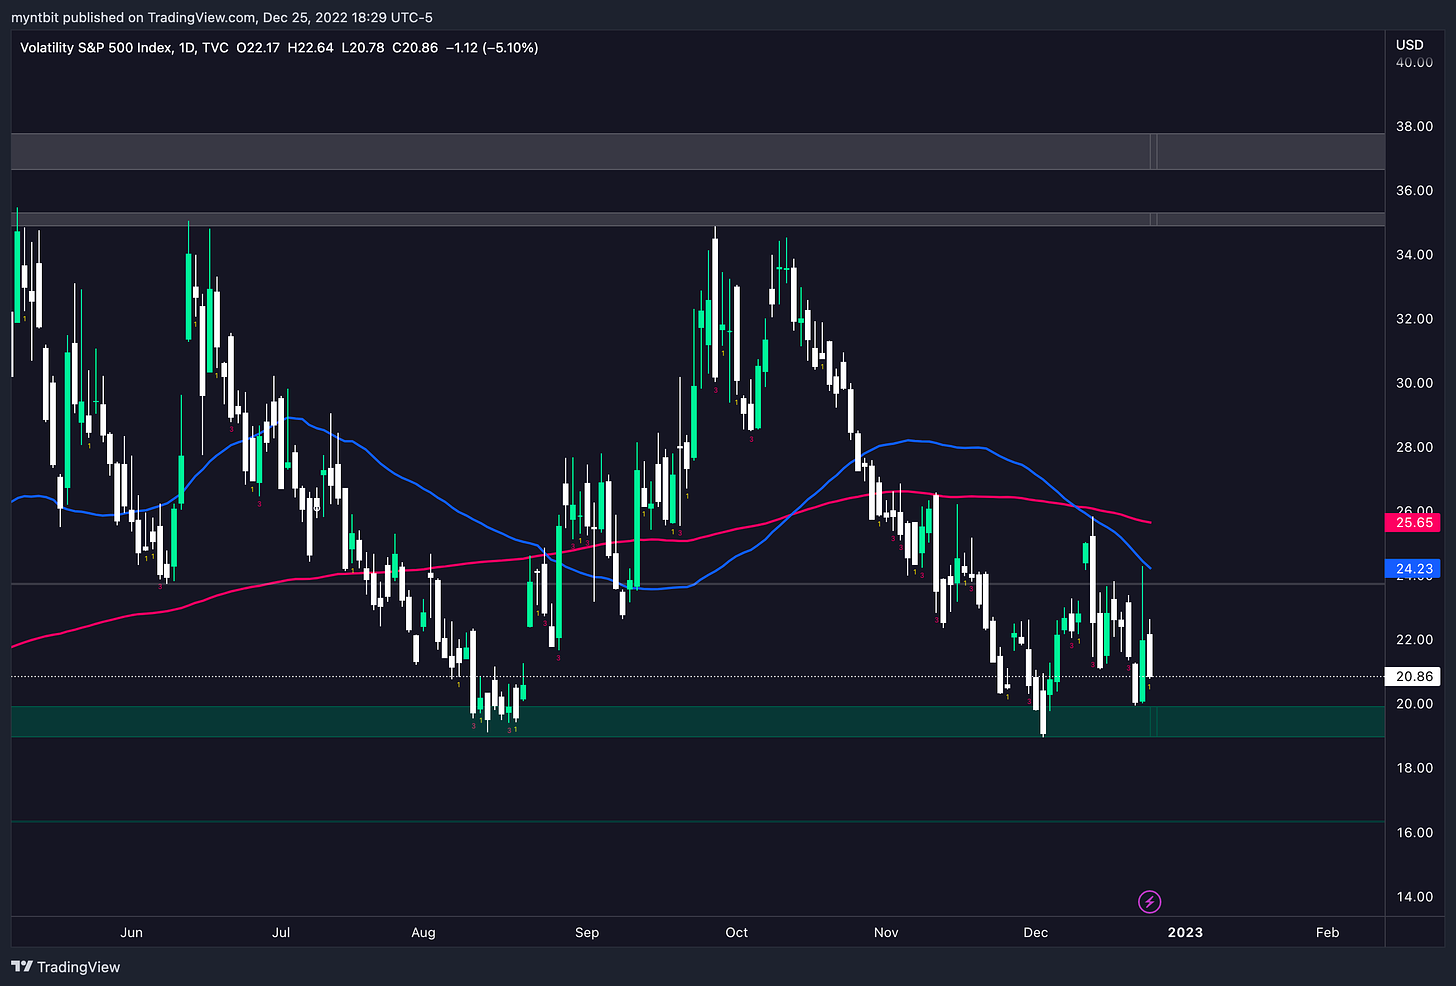
VIX - Volatility Index
Support: 20
Resistance: 22.50, 24
🔴 VIX Trend Indicator
SPDY Sectors & ETFs
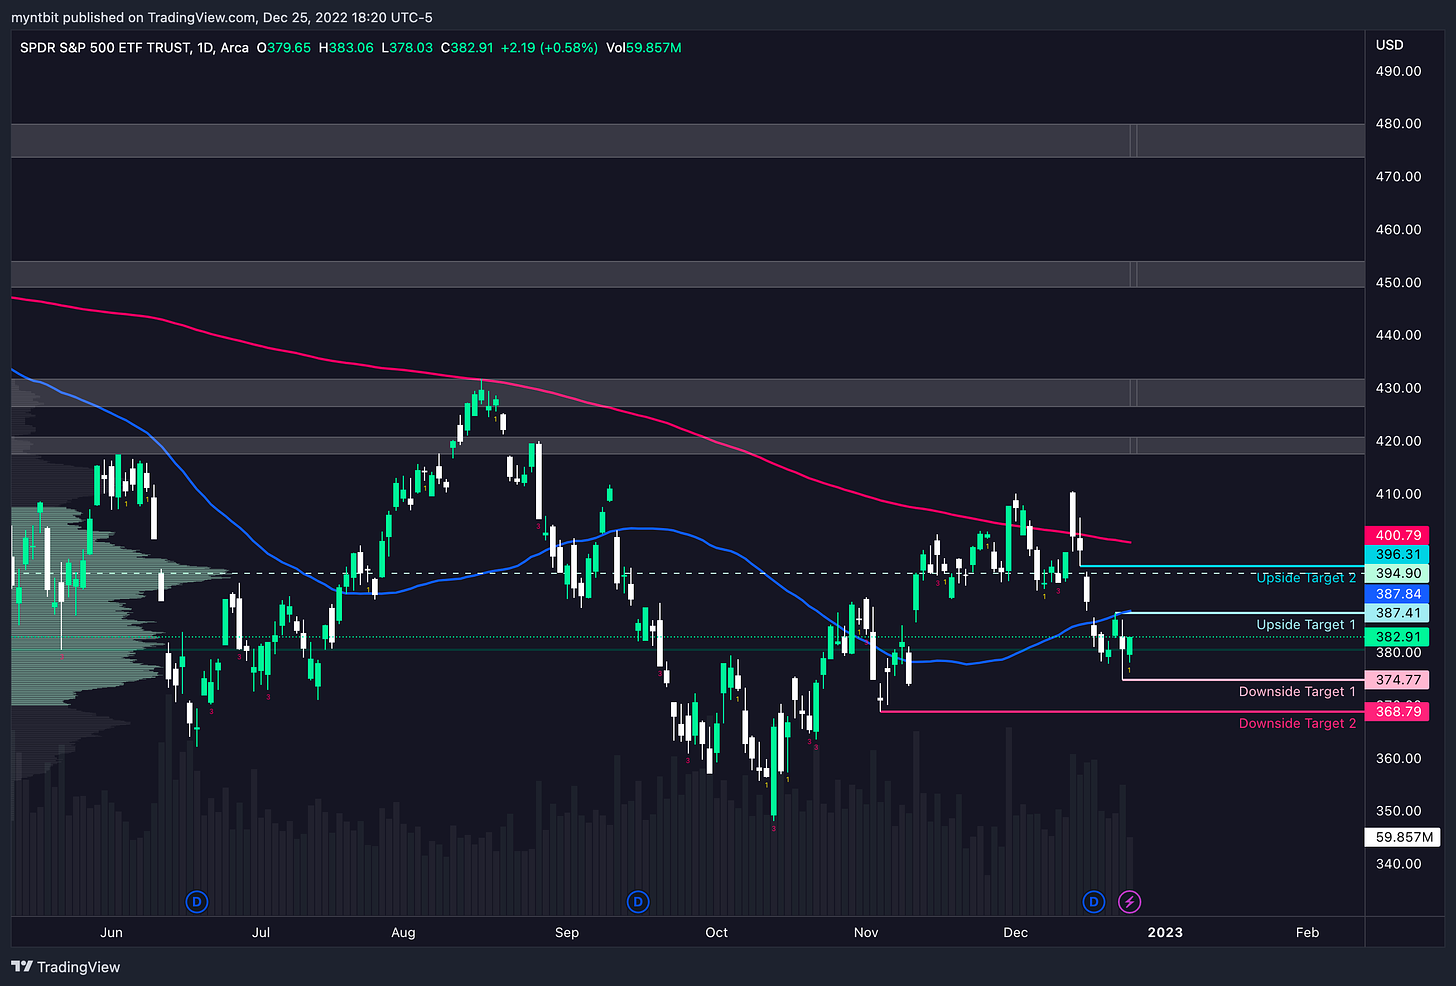
SPY - S&P 500 ETF
Moving Averages: On Daily, 200-day SMA at 400.79 and 50 SMA at 387.84.
The Strat: Weekly is 3-2d and Daily with a 1 inside bar.
Upside: 387.41, 396.31
Downside: 374.77, 368.79
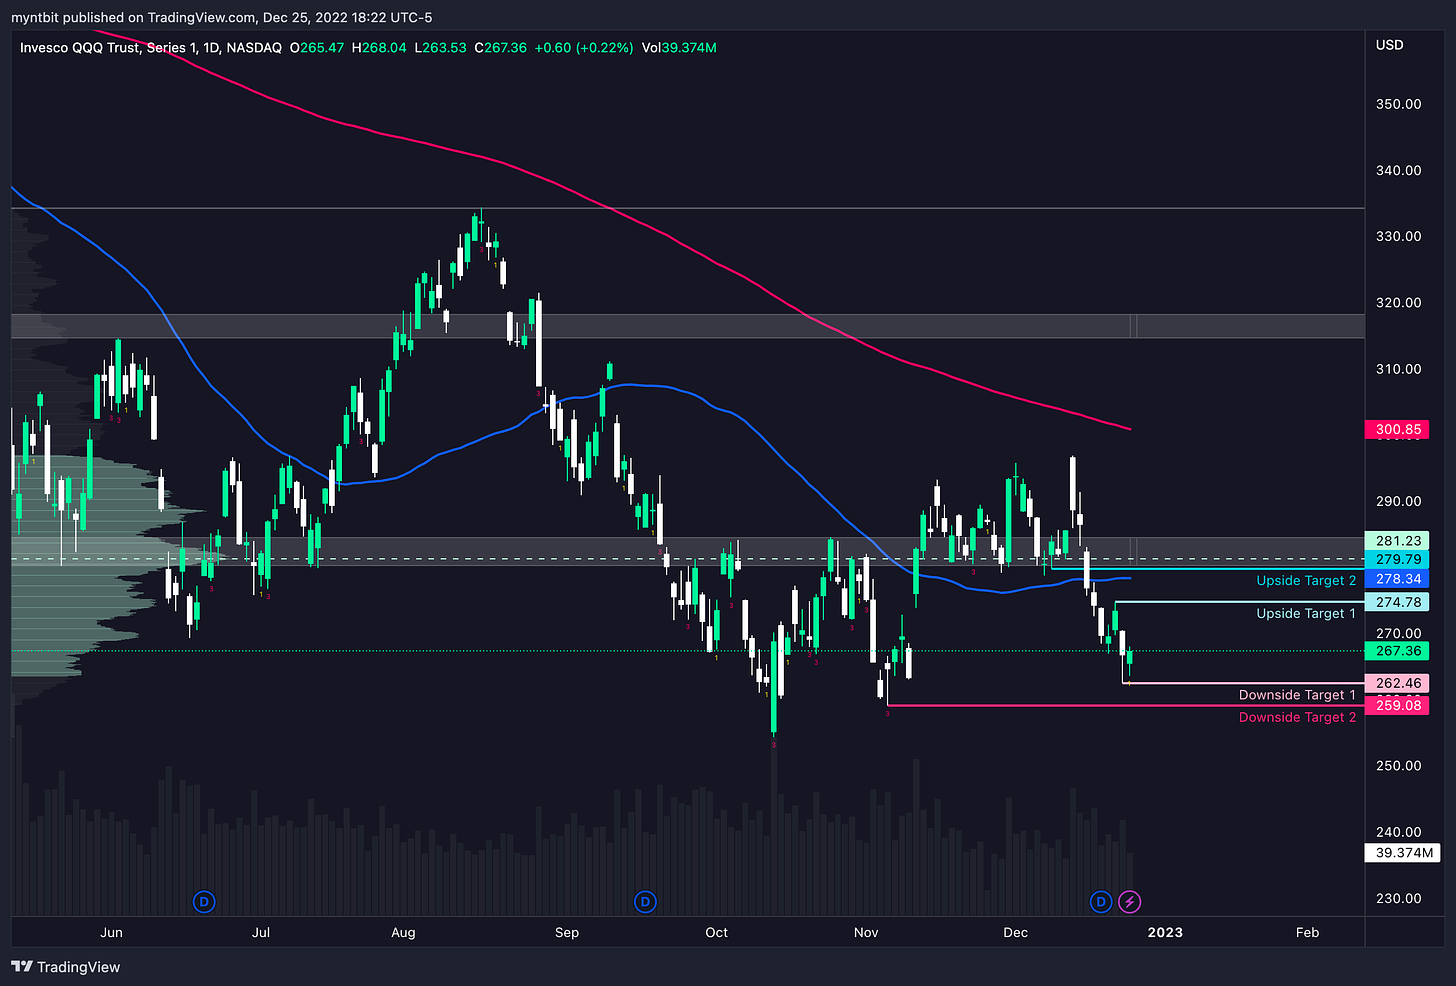
QQQ - Nasdaq 100 ETF
Moving Averages: On Daily, 200-day SMA at 300.85 and 50 SMA at 278.34.
The Strat: Weekly is 3-2d and Daily with a 1 inside bar.
Upside: 274.78, 279.79
Downside: 262.46, 259.08
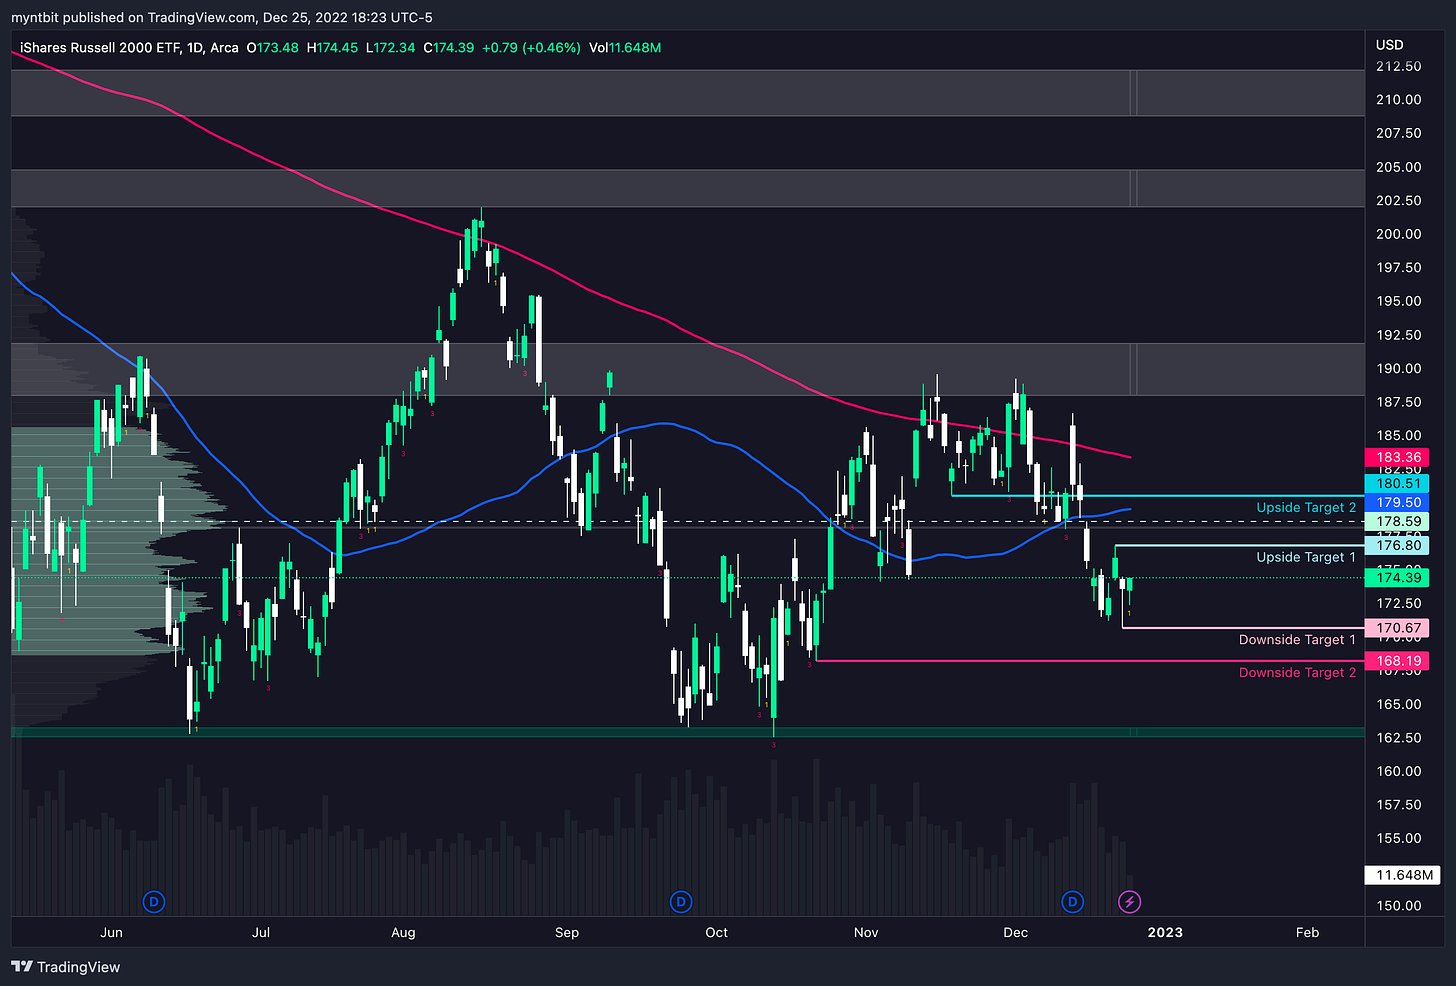
IWM - Russell 2000 ETF
Moving Averages: On Daily, 200-day SMA at 183.38 and 50 SMA at 179.50.
The Strat: Weekly is 3-2d and Daily with a 1 inside bar.
Upside: 176.80, 180.51
Downside: 170.67, 168.19
Stocks To Watch
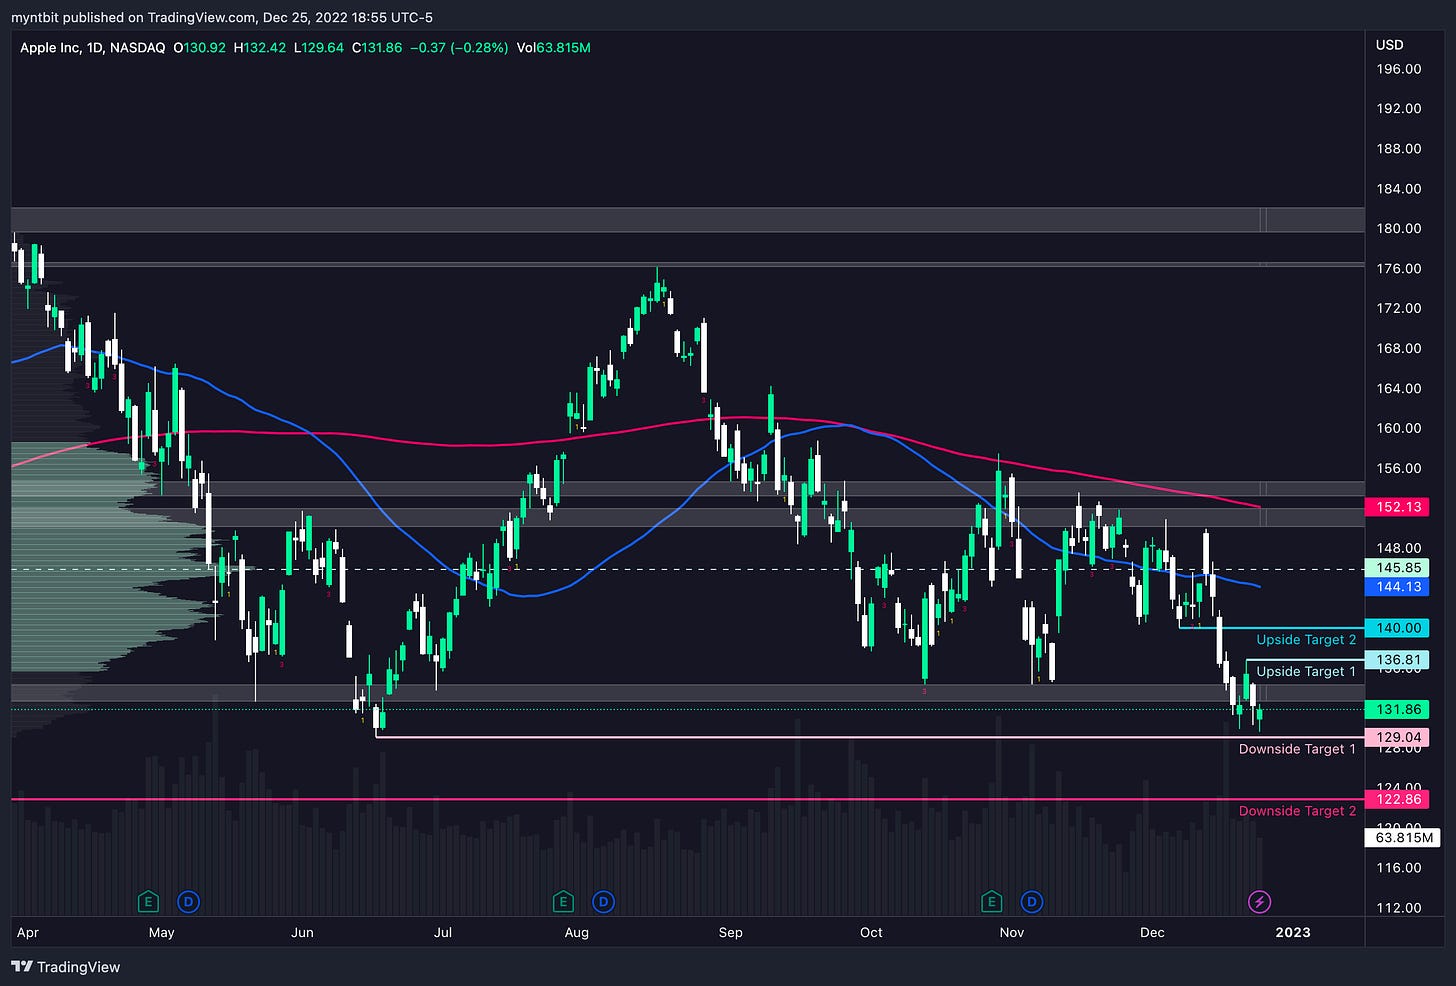
AAPL - Apple Inc
Moving Averages: On Daily, 200-day SMA at 152.13 and 50 SMA at 144.13.
The Strat: Weekly is 2d-2d and Daily with a 2d -2d.
Upside: 136.81, 140.00
Downside: 129.04, 122.86
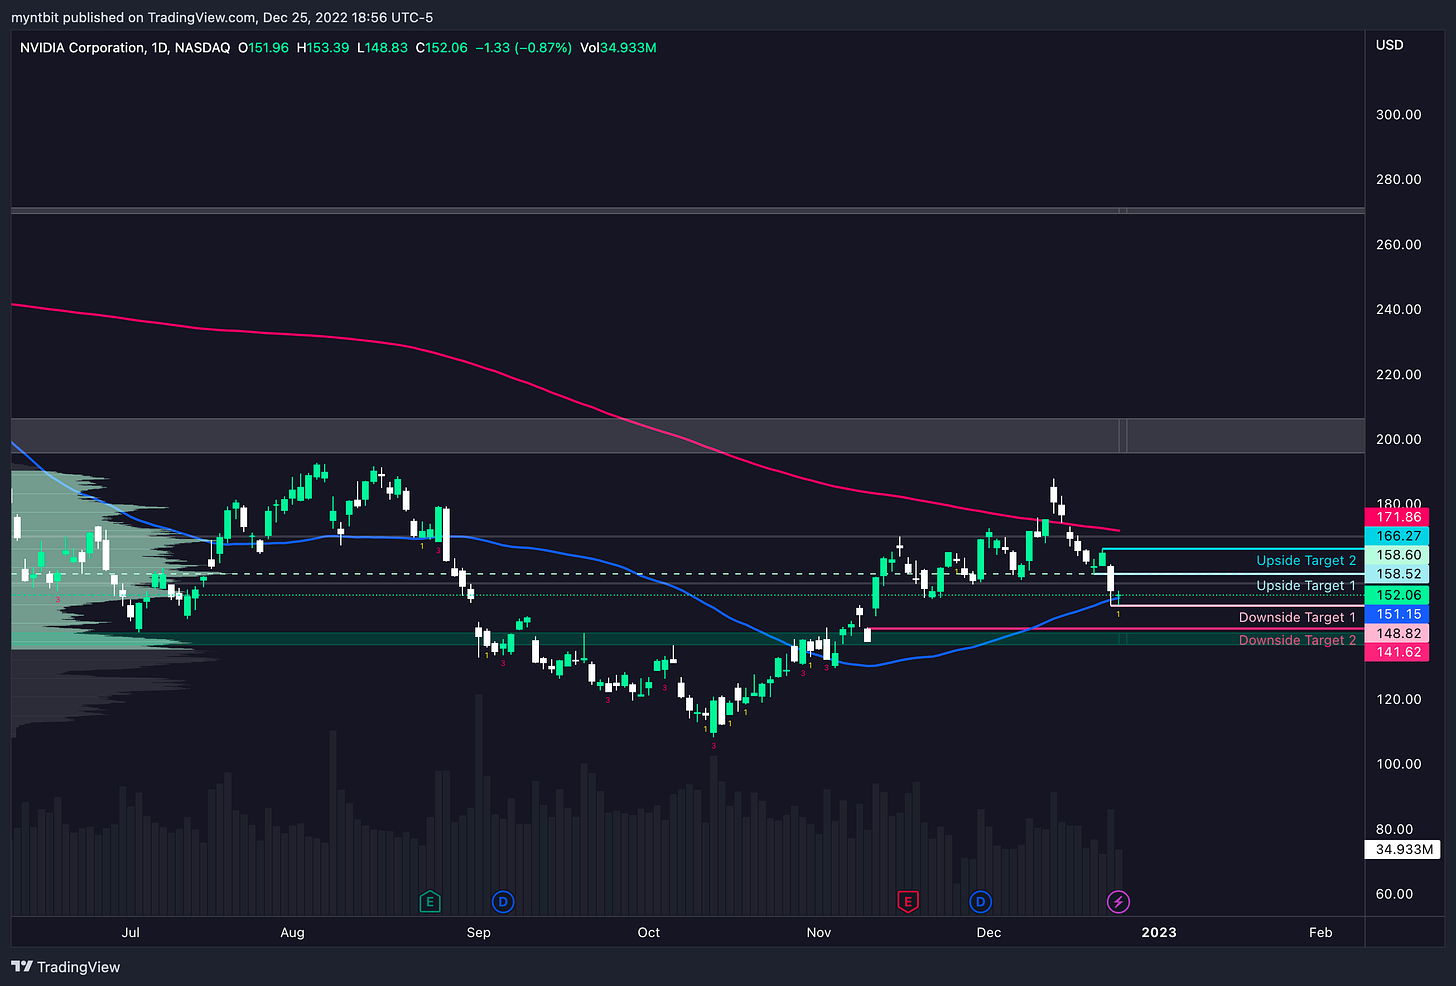
NVDA - NVIDIA Corporation
Moving Averages: On Daily, 200-day SMA at 171.86 and 50 SMA at 151.15.
The Strat: Weekly is 3-2d and Daily with a 1 inside bar.
Upside: 158.52, 166.27
Downside: 148.82, 141.62
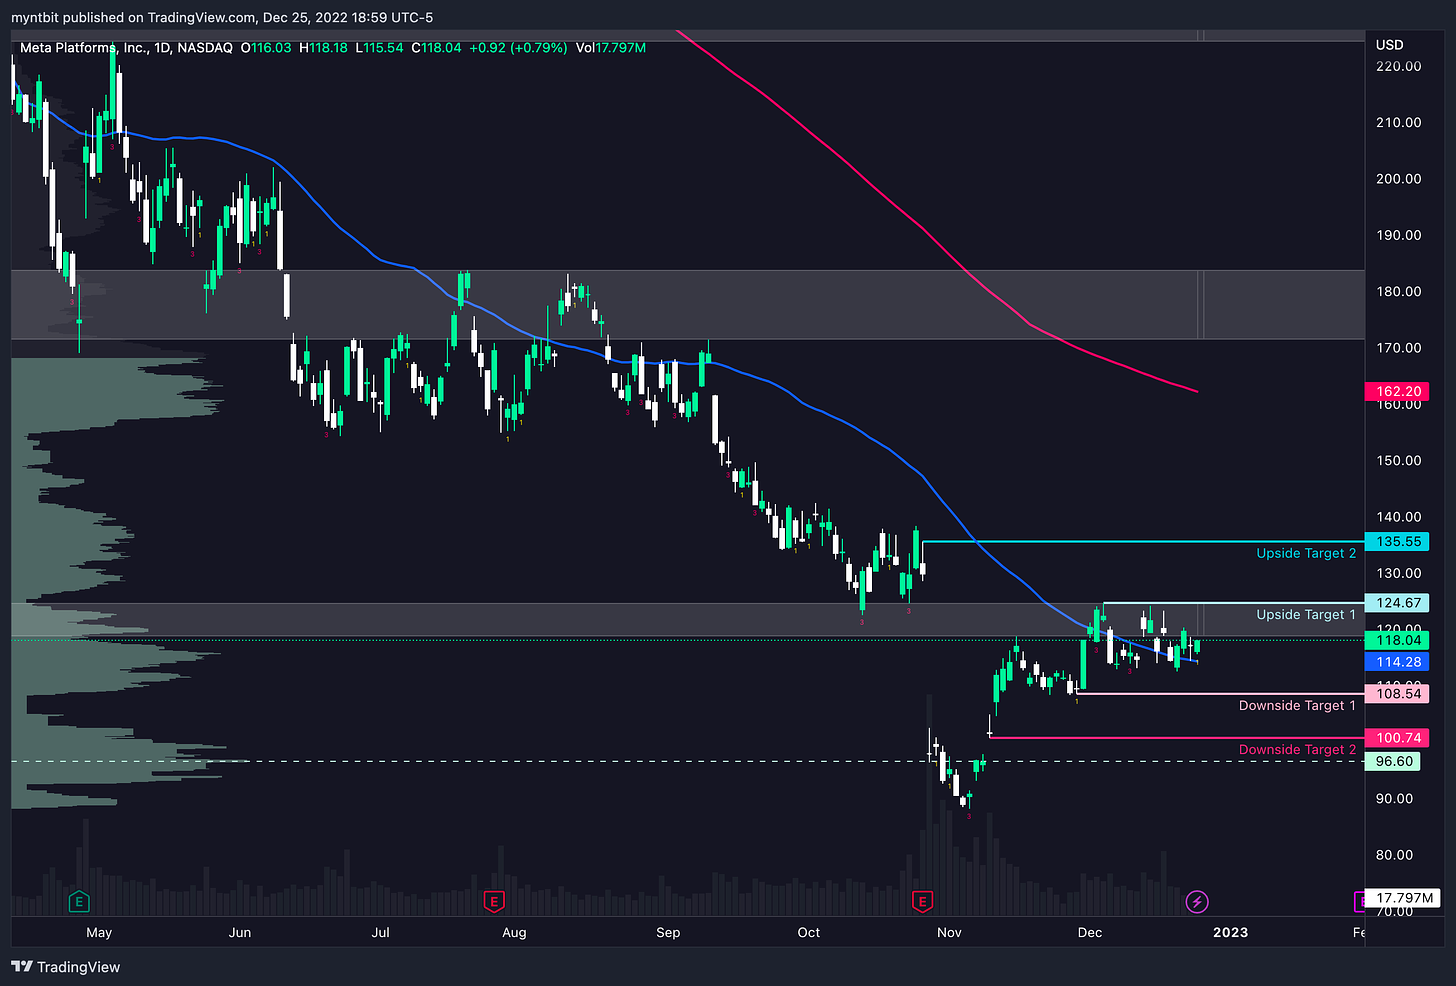
META - Meta Platforms Inc
Moving Averages: On Daily, 200-day SMA at 162.20 and 50 SMA at 114.28.
The Strat: Weekly is 1-2d and Daily with a 1 inside bar.
Upside: 124.67, 135.55
Downside: 108.54, 100.74
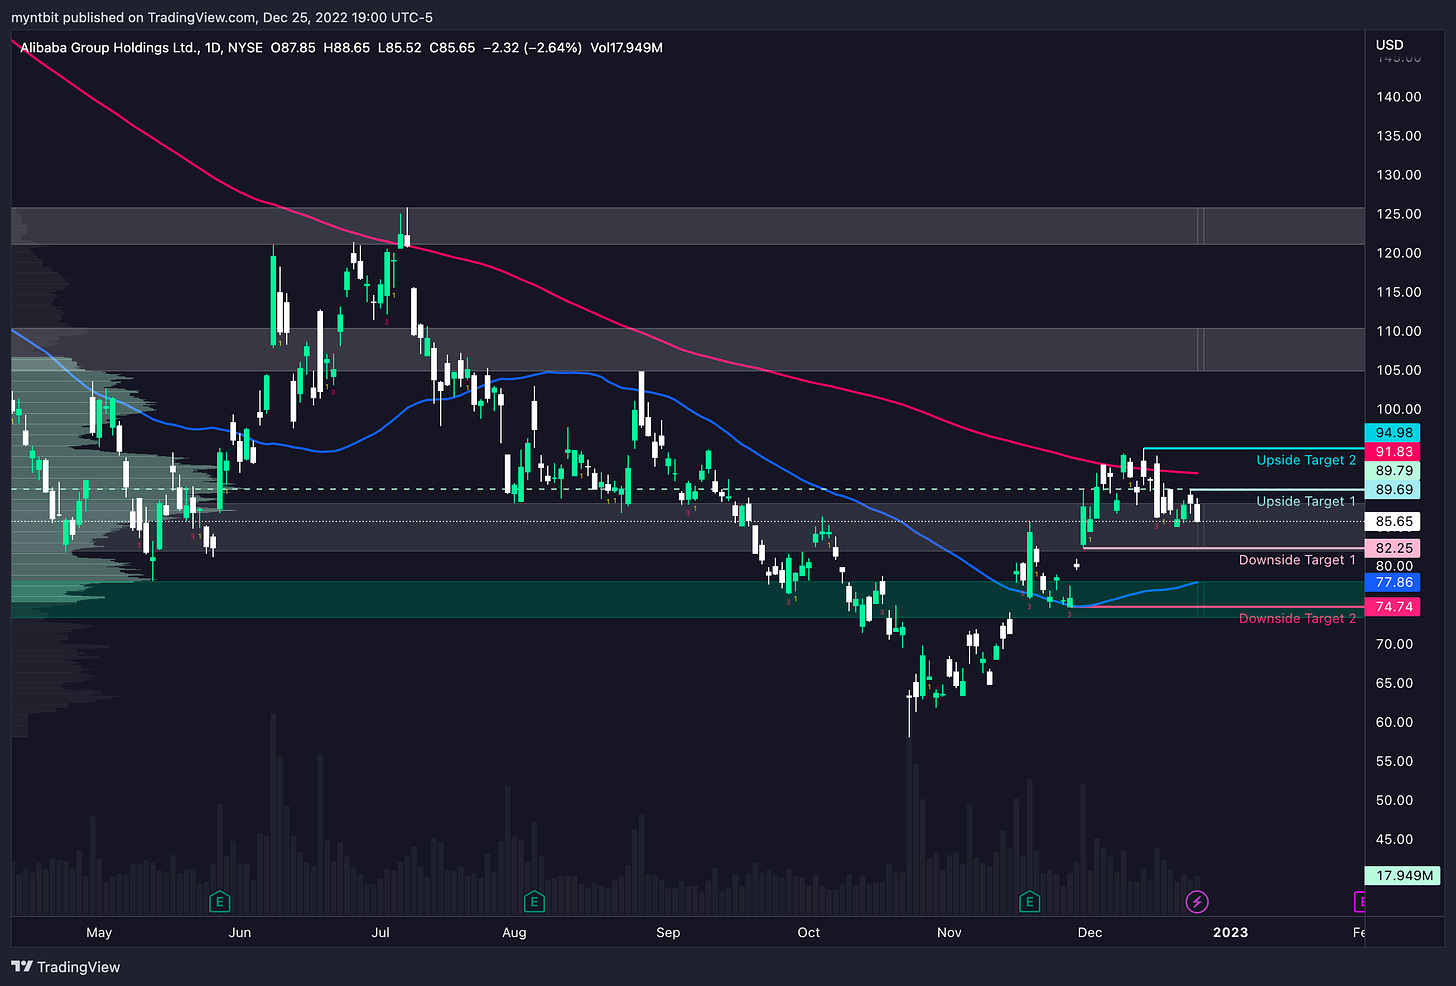
BABA - Alibaba Group Holding Limited
Moving Averages: On Daily, 200-day SMA at 91.83 and 50 SMA at 77.86.
The Strat: Daily, 2u - 2d, and Weekly, 3 - 2d.
Upside: 89.69, 94.98
Downside: 82.25, 74.74
Looking Ahead
Next week is set to be a quiet week as the market looks to wrap up its 2022 year. Market participants will be eyeing updates on real estate data, including S&P CoreLogic’s Case-Schiller Index, Federal Housing Finance Agency’s (FHFA) House Price Index, and pending home sales.
Internationally, investors can look for key economic data from Japan and China throughout the week. In Japan, annualized retail sales are expected to slightly decrease by 1.3% in November from the prior month’s 4.3% while analysts expect November’s preliminary industrial production to significantly drop to -0.8% year-over-year from October’s finalized 3%.
Meanwhile, China is slated to release December’s composite, manufacturing, and non-manufacturing Purchasing Managers’ Index (PMI) late Friday afternoon.
Source: wellsfargoadvisors.com
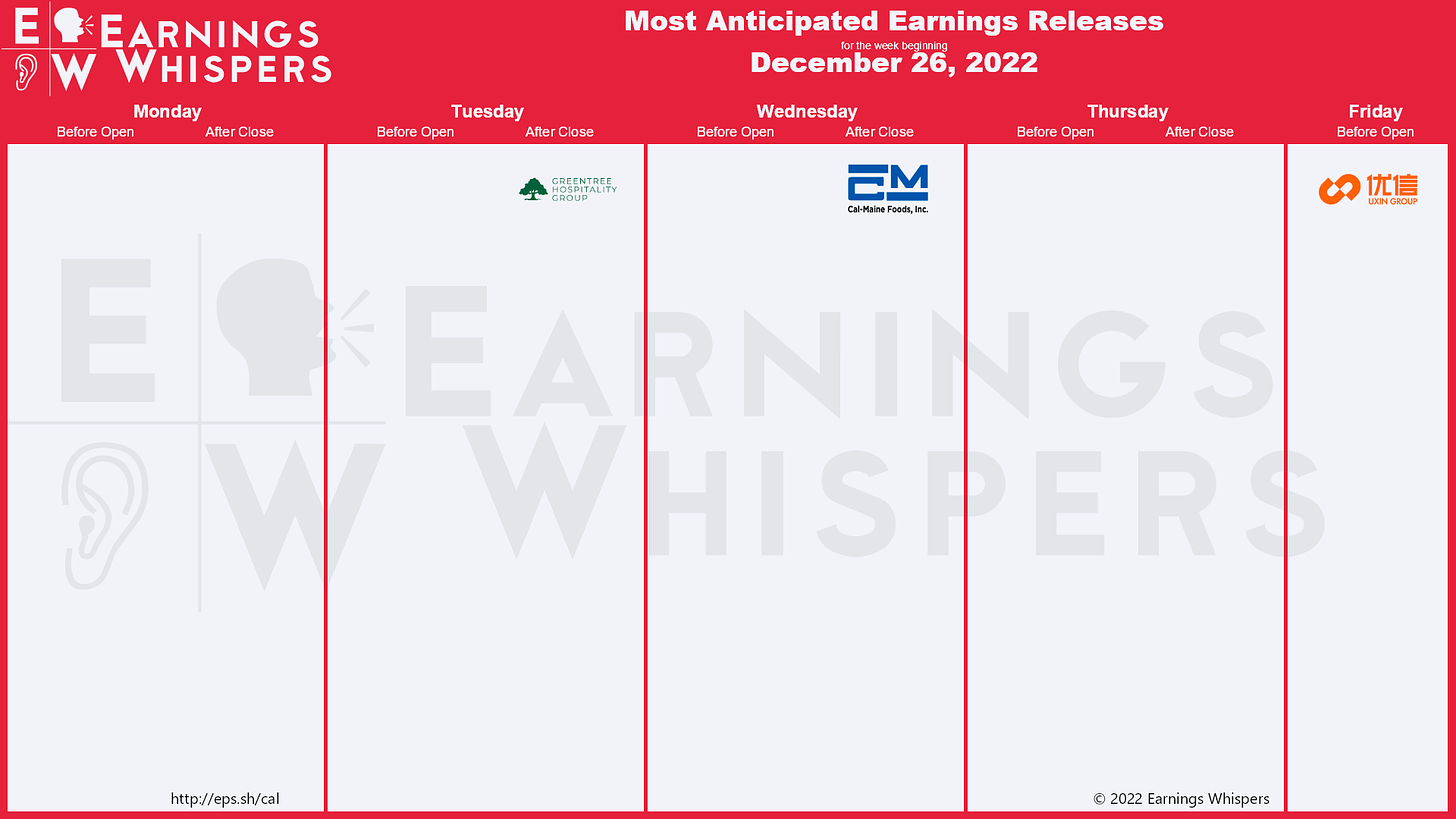
Earnings Calendar
Economical Events
Did you enjoy this post?
If you want more detailed levels and a game plan check out our Discord:
Daily Levels for all the stocks
User stock posts if you want a stock charted with levels, let’s talk about it and create a game plan
Live Streams with Q&A
Join the MyntBit Discord Server!
Thank you for reading MyntBit Newsletter. Please share on Twitter!
Disclaimer: This newsletter is not trading or investment advice, but for general informational purposes only. This newsletter represents our personal opinions which we are sharing publicly for educational purposes. Futures, stocks, and bonds trading of any kind involves a lot of risks. No guarantee of any profit whatsoever is made. In fact, you may lose everything you have. So be very careful. We guarantee no profit whatsoever, You assume the entire cost and risk of any trading or investing activities you choose to undertake. You are solely responsible for making your own investment decisions. Owners/authors of this newsletter, its representatives, its principals, its moderators, and its members, are NOT registered as securities broker-dealers or investment advisors either with the U.S. Securities and Exchange Commission, CFTC or with any other securities/regulatory authority. Consult with a registered investment advisor, broker-dealer, and/or financial advisor. By reading and using this newsletter or any of my publications, you are agreeing to these terms. Any screenshots used here are the courtesy of Briefing.com, FXstreet, Google Finance, Unusual Whale, Refinitiv, and/or Tradingview. We are just end-users with no affiliations with them.
Thanks for reading MyntBit Newsletter! Subscribe for free to receive new posts and support our work.


