Daily Newsletter Oct 27 '22

What is included in tomorrow's game plan?
Daily Recap
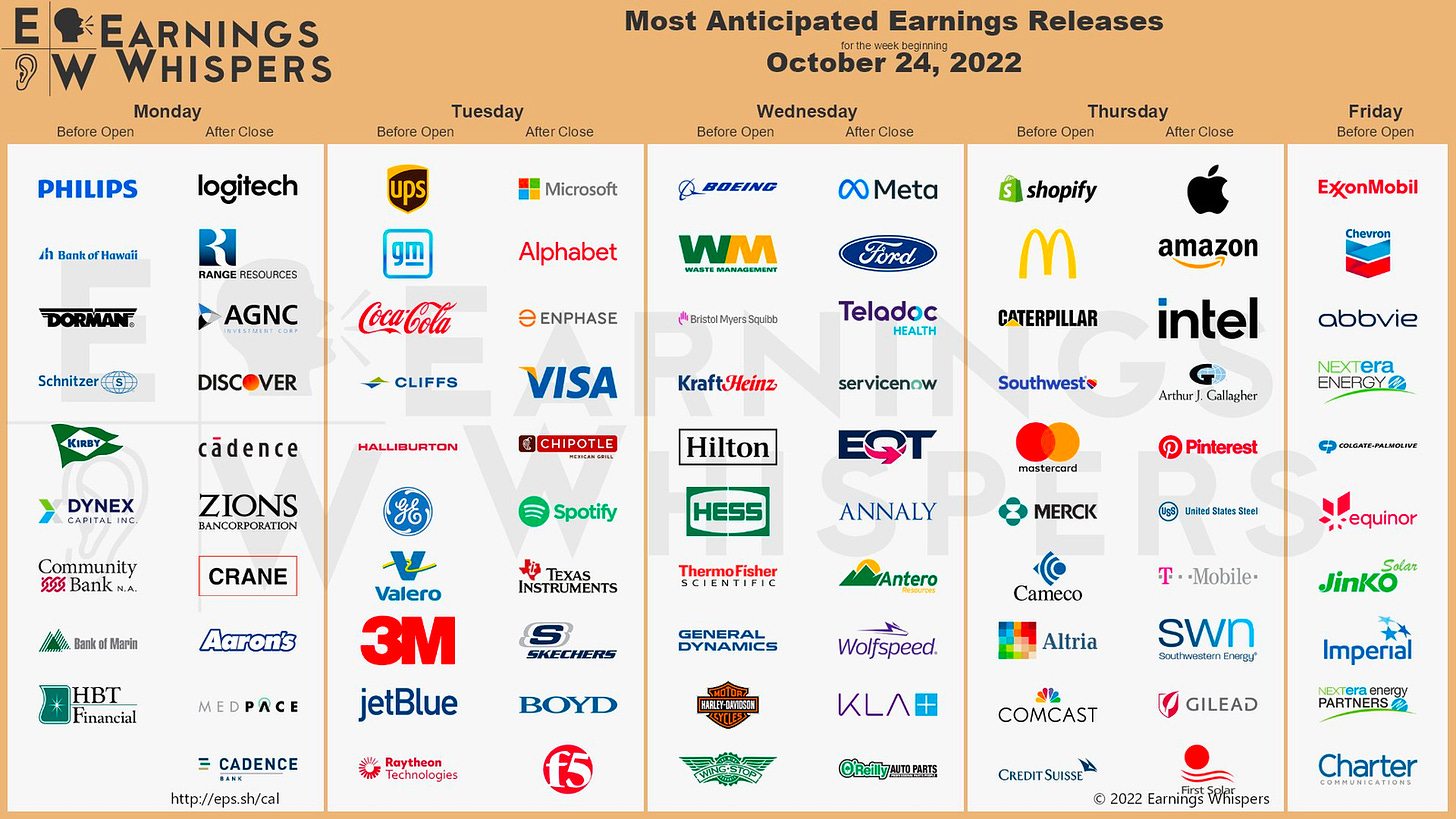
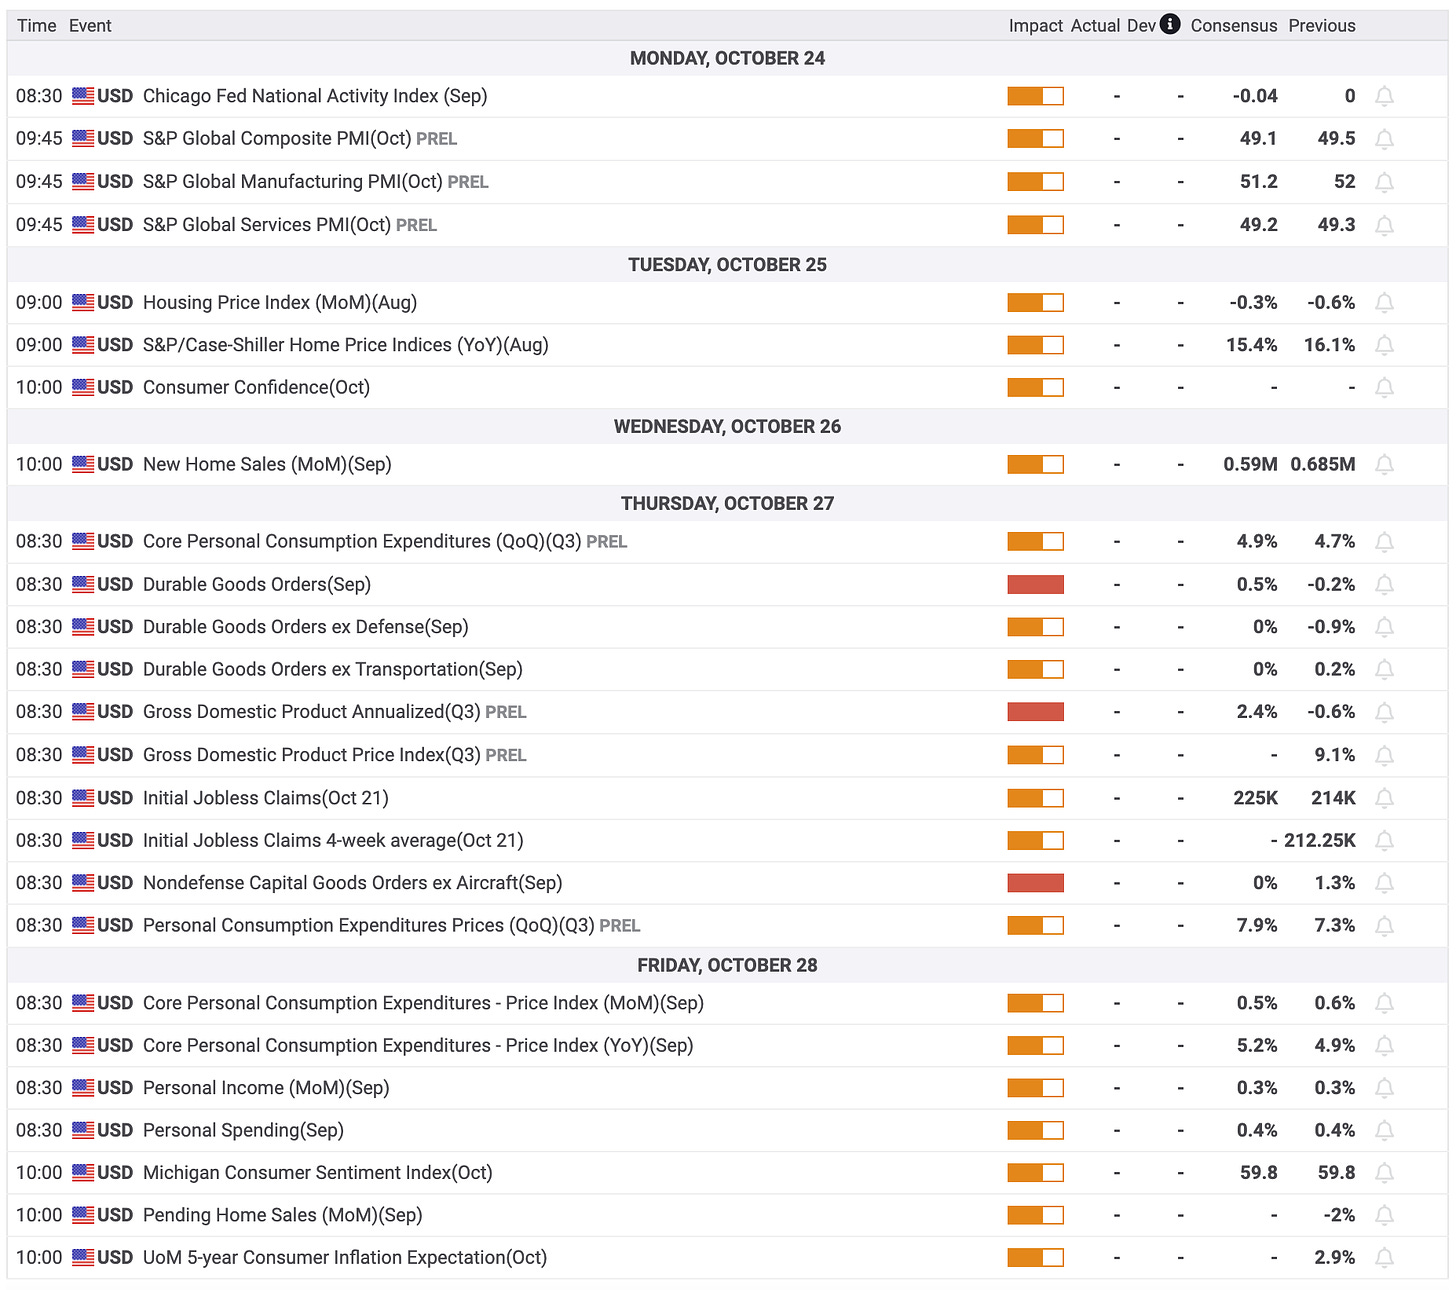
Look Ahead - Economic & Earnings Calendar
Key Futures Levels - S&P 500 (/ES) and NASDAQ (/NQ)
Day Trade Stock Ideas - $RBLX | $TTD - Details will be provided in Discord
Today's Recap
Market Snapshot
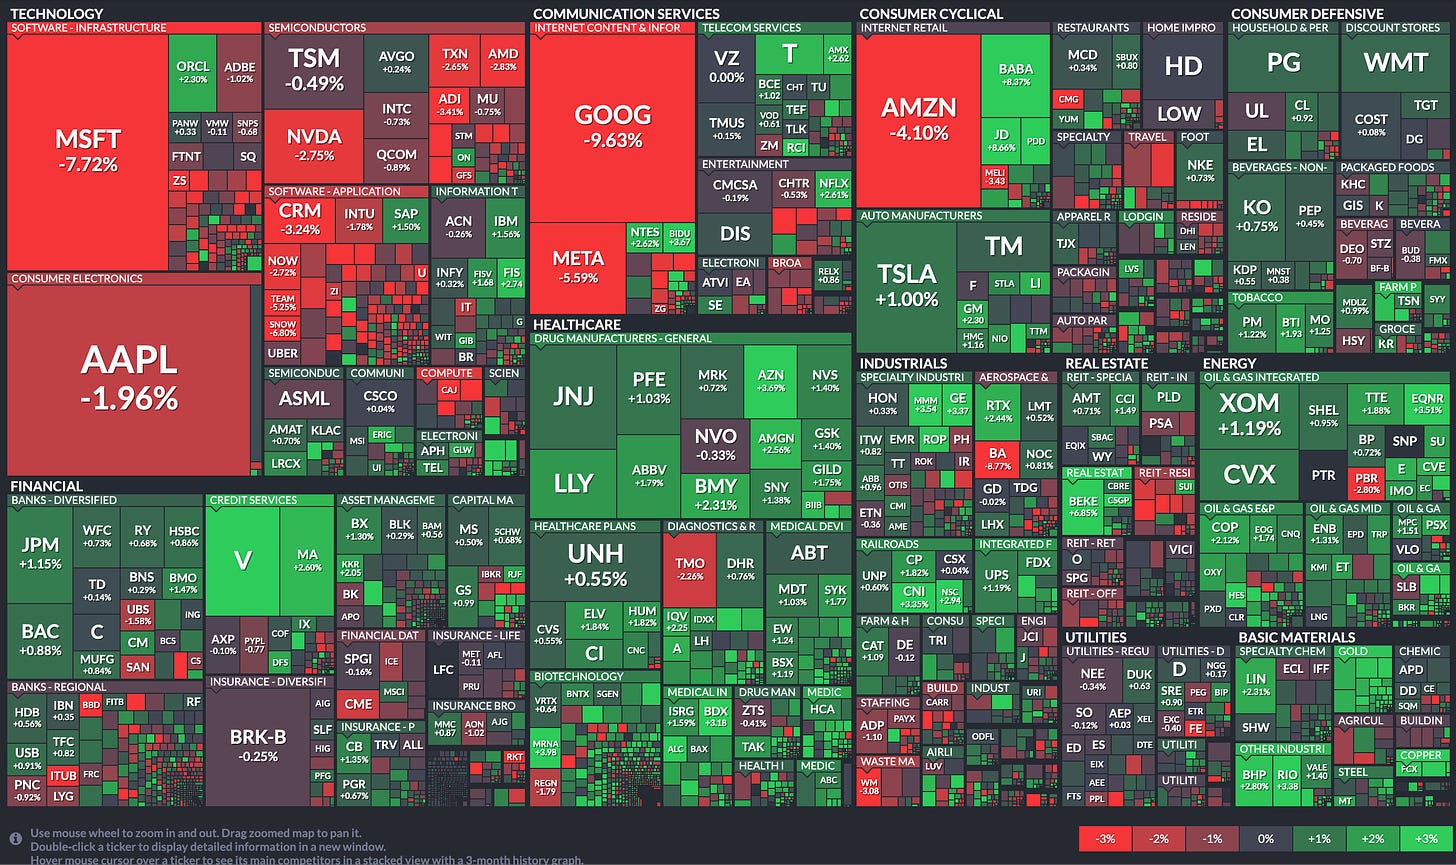
Market Heatmap
Sector Heatmap
Market Recap
The stock market had a choppy session today. The S&P 500 was above its 50-day simple moving average (3860.02) and up 0.7% at today's high. It closed with a loss of 0.7%. The major averages were steered by price action in the mega cap stocks.
Alphabet (GOOG 94.82, -10.11, -9.6%) and Microsoft (MSFT 231.32, -19.34, -7.7%) led the downside charge following their earnings reports, yet worries about what may come for Apple (AAPL 149.35, -2.99, -2.0%) and Amazon.com (AMZN 115.66, -4.94, -4.1%), when they report later this week, undercut the heavily-weighted and widely-held stocks.
The Dow Jones Industrial Average was able to close just a whisker above the flat line thanks in part to the earnings-driven gain in Visa (V 203.33, +8.95, +4.6%). Gains were limited, however, due to a big loss in Boeing (BA 133.79, -12.86, -8.8%). The company reported disappointing quarterly results and said its path to recovery is taking a bit longer than expected driven by the challenging macro environment. Supply constraints continue to impact production in both its commercial and defense businesses.
There was underlying strength in today's trade, however, as the Invesco S&P 500 Equal Weight ETF (RSP) closed with a 0.2% gain. Also, advancers led decliners by a roughly 4-to-3 margin at both the NYSE and the Nasdaq.
Factors supporting the broader market included favorable quarterly results from names like Harley-Davidson (HOG 41.80, +4.68, +12.6%) and Bristol-Meyers (BMY 74.45, +1.68, +2.3%), a growing belief that the Fed will soften its approach after the November meeting, and a pullback in Treasury yields. The 10-yr note yield fell nine basis points to 4.02% and the 2-yr note yield fell four basis points to 4..42%.
Roughly half of the 11 S&P 500 sectors closed with a gain, led by energy (+1.4%) amid rising oil prices. WTI crude oil futures rose 3.4% to $87.86/bbl.
Meanwhile, the communication services sector (-4.8%) was the worst performer by a wide margin, largely due to Alphabet and Meta Platforms (META 129.82, -7.69, -5.6%). Information technology (-1.1%) was another top laggard thanks to its mega cap components, but its losses were limited by big earnings-driven gains in Enphase Energy (ENPH 291.87, +26.28, +9.9%) and Visa.
Small and mid cap stocks fared better than their larger peers today. The Russell 2000 (+0.5%) and S&P Mid Cap 400 (+0.2%) both logged a modest gain on the day.
Ahead of Thursday's open, Comcast (CMCSA), Anheuser-Busch InBev (BUD), Caterpillar (CAT), Merck (MRK), Northrop Grumman (NOC), Honeywell (HON), AutoNation (AN), McDonald's (MCD), Mastercard (MA), and Altria (MO) are set to report earnings.
Thursday's economic data includes:
8:30 ET: Advance Q3 GDP (Briefing.com consensus 2.3%; prior -0.6%), advance Q3 Chain Deflator (Briefing.com consensus 5.3%; prior 9.0%), weekly Initial Claims (Briefing.com consensus 220,000; prior 214,000), Continuing Claims (prior 1.385 mln), September Durable Orders (Briefing.com consensus 0.6%; prior -0.2%), and Durable Orders ex-transportation (Briefing.com consensus 0.2%; prior 0.2%)
10:30 ET: Weekly natural gas inventories (prior +111 bcf)
Reviewing today's economic data:
Weekly MBA Mortgage Application Index -1.7%; Prior -4.5%
September Adv. Intl. Trade in Goods -$92.2 bln; Prior -$87.3 bln
September Adv. Retail Inventories 0.4%; Prior 1.4%
September Adv. Wholesale Inventories 0.8%; Prior was revised to 1.4% from 1.3%
September New Home Sales 603K (Briefing.com consensus 575K); Prior was revised to 677K from 685K
The key takeaway from the report is that it reflects how the spike in mortgage rates has created affordability pressures for lower-income buyers. The jump in median and average selling prices was skewed by higher-priced homes accounting for a larger percentage of total new homes sold.
Dow Jones Industrial Average: -12.4% YTD
S&P Midcap 400: -15.9% YTD
S&P 500: -19.6% YTD
Russell 2000: -19.6% YTD
Nasdaq Composite: -29.9% YTD
source: briefing.com


