Weekly Report | 17 July 2022
MyntBit Weekly Report is dedicated to helping traders bring setups with a time horizon from days to weeks depending on price action.

Market Snapshot
Indices, Futures and Forex by TradingView
BRIEFING.COM Weekly Wrap
The stock market endured another volatile week that began with three days of selling and ended with a rebound that lifted the S&P 500 off its lowest level in nearly four weeks. Still, the benchmark index surrendered 0.9% for the week while the Nasdaq (-1.6%) underperformed and the Dow (-0.2%) finished with a slimmer loss for the week.
The market began the week on an apprehensive note, due in part to hesitation ahead of Wednesday's release of June CPI. In addition, concerns about global growth continued weighing on sentiment. Spain's Prime Minister Sanchez warned that his country is likely to see lower than expected growth in the coming months, Shell (SHEL) CEO warned that Europe may have to ration energy in the winter, and there were reports of a growing number of people in China boycotting their mortgage payments.
Renewed political turmoil in Italy after Prime Minister Draghi lost support of a major coalition partner briefly drove the euro below parity against the dollar, helping the U.S. Dollar Index secure its third consecutive weekly gain with the Index reaching its highest level since September 2002.
Wednesday saw the release of the June CPI report, which showed a 1.3% month-over-month increase that lifted the yr/yr growth rate to 9.1%, a level not seen since late 1981. The food index was up 9.1% year-over-year while the energy index was up a stunning 41.6% year-over-year. Thursday's release of the June PPI report did little to soothe fears about inflation as headline PPI increased 1.1% month-over-month, lifting the yr/yr PPI rate to 11.3%, just shy of the March peak (11.5%).
Bank earnings for Q2 began coming in during the latter part of the week, starting with disappointing reports from JPMorgan Chase (JPM) and Morgan Stanley (MS). Comments from JPM CEO Dimon received a lot of attention after he expressed worries about unprecedented tightening in the face of significant global turmoil.
Equities finished their down week on a positive note, drawing some support from the preliminary University of Michigan Consumer Sentiment survey for July, which showed an improvement in sentiment due to a dip in inflation expectations after the recent drop in energy prices. This was a positive development, but it could be reversed in a flash if energy prices continue rebounding. WTI crude fell past its 200-day moving average (93.57) to a level not seen since late February on Thursday but bounced to finish Friday's session $7.38, or 8.2%, above its low from Thursday.
Want To Learn Volume Profile?

Market Profile
A profile is a type of advanced order flow analysis that shows the volume distribution at different prices over time. Profile, which appears as a horizontal histogram on a chart, can identify important price levels such as support and resistance.
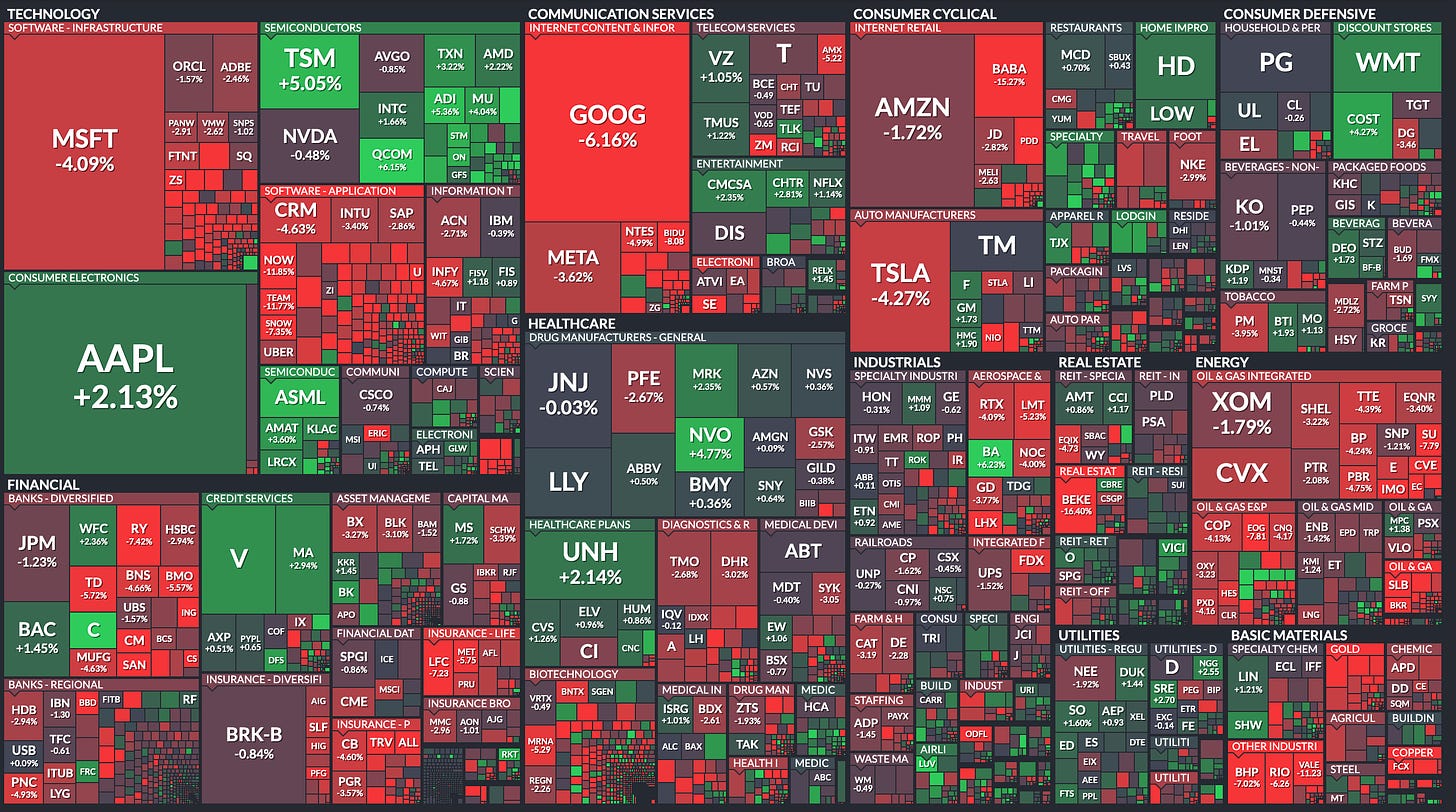
Market Heatmap
Futures Markets
/ES - Emini S&P 500
ES1! Chart by TradingView
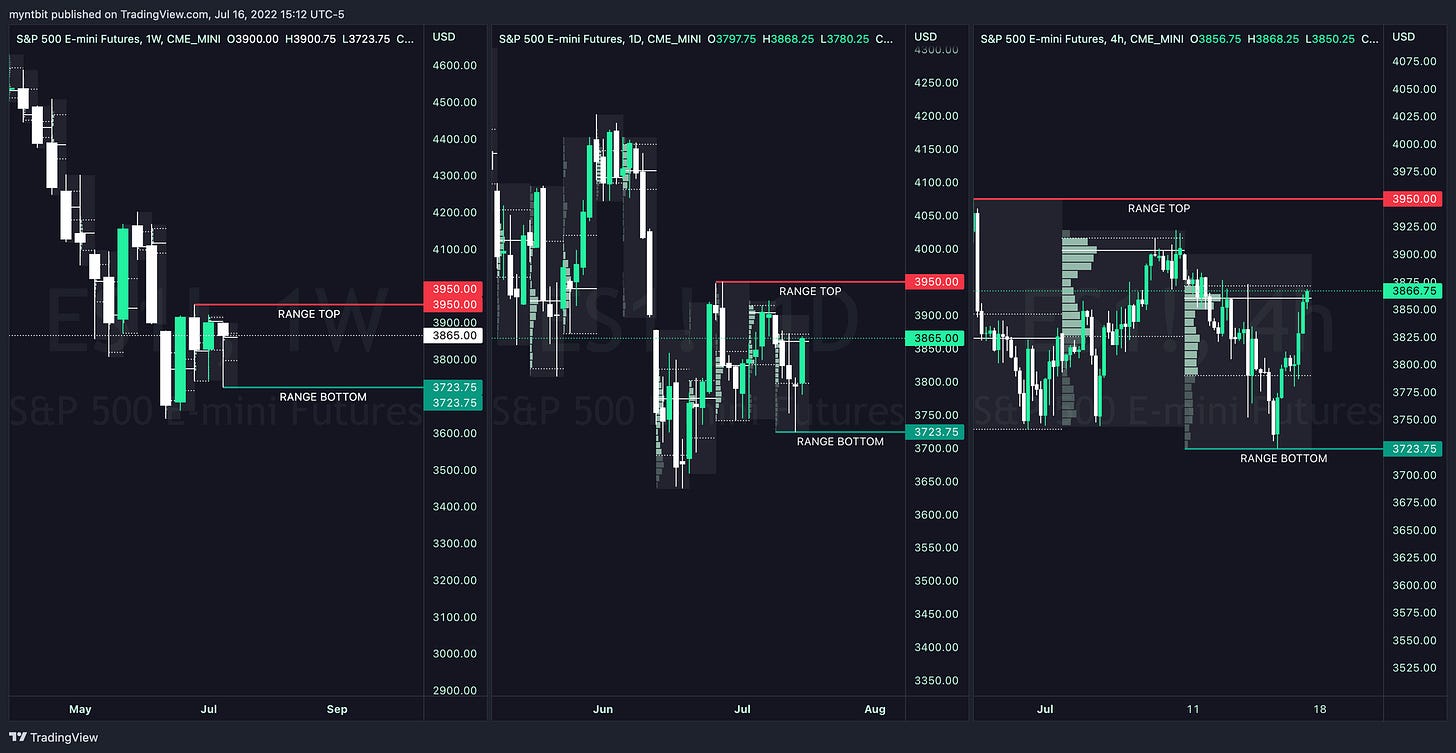
ES stayed tight in the consolidation range throughout the week. We did dip below the range lows but saw buyers coming in at lows to finish strong.
Bull Case - The trip to 4000 is still on the cards as SPY & SPX have a gap to up there but before that, we needs to break above 3950 which has been held so far.
Bear Case - The support at 3750 was tested and broken to create a new base at 3723, so a move under 3780 could see us test these lows again.
POC: 3860
VAH: 3871 | VAL: 3790
Range: 3723 - 3950
/NQ - Emini Nasdaq 100
NQ1! Chart by TradingView
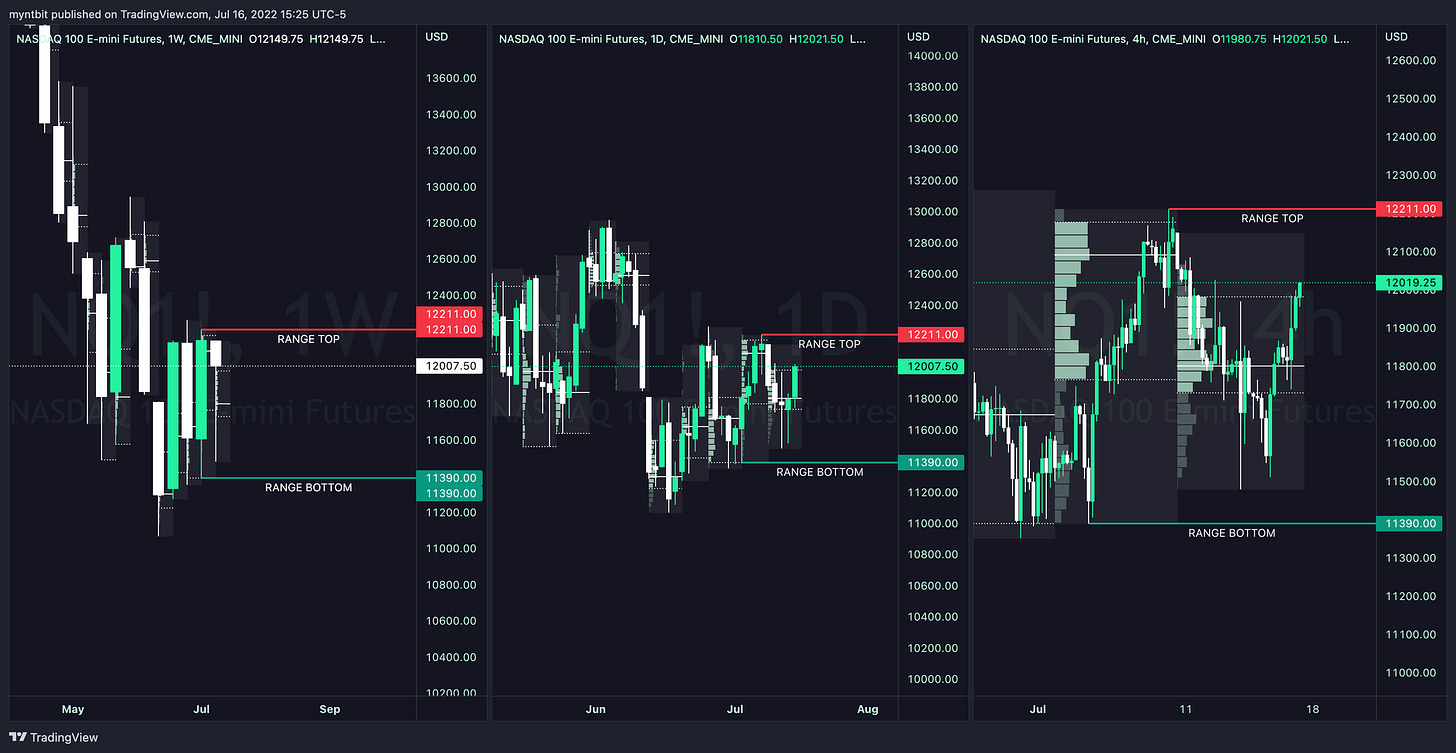
NQ led the rest of the indices but also stayed tight in the consolidation range throughout the week.
Bull Case - The trip to 12600 could be on cards on the upside once the top of the range 12211 is broken.
Bear Case - If NQ fails to break 12211, further weakness in NQ, 11808 needs to be broken. Keep in mind, that the range low at 11390 has not been test yet.
POC: 11808
VAH: 11732 | VAL: 11981
Range: 11390 - 12211
SPDR Sectors
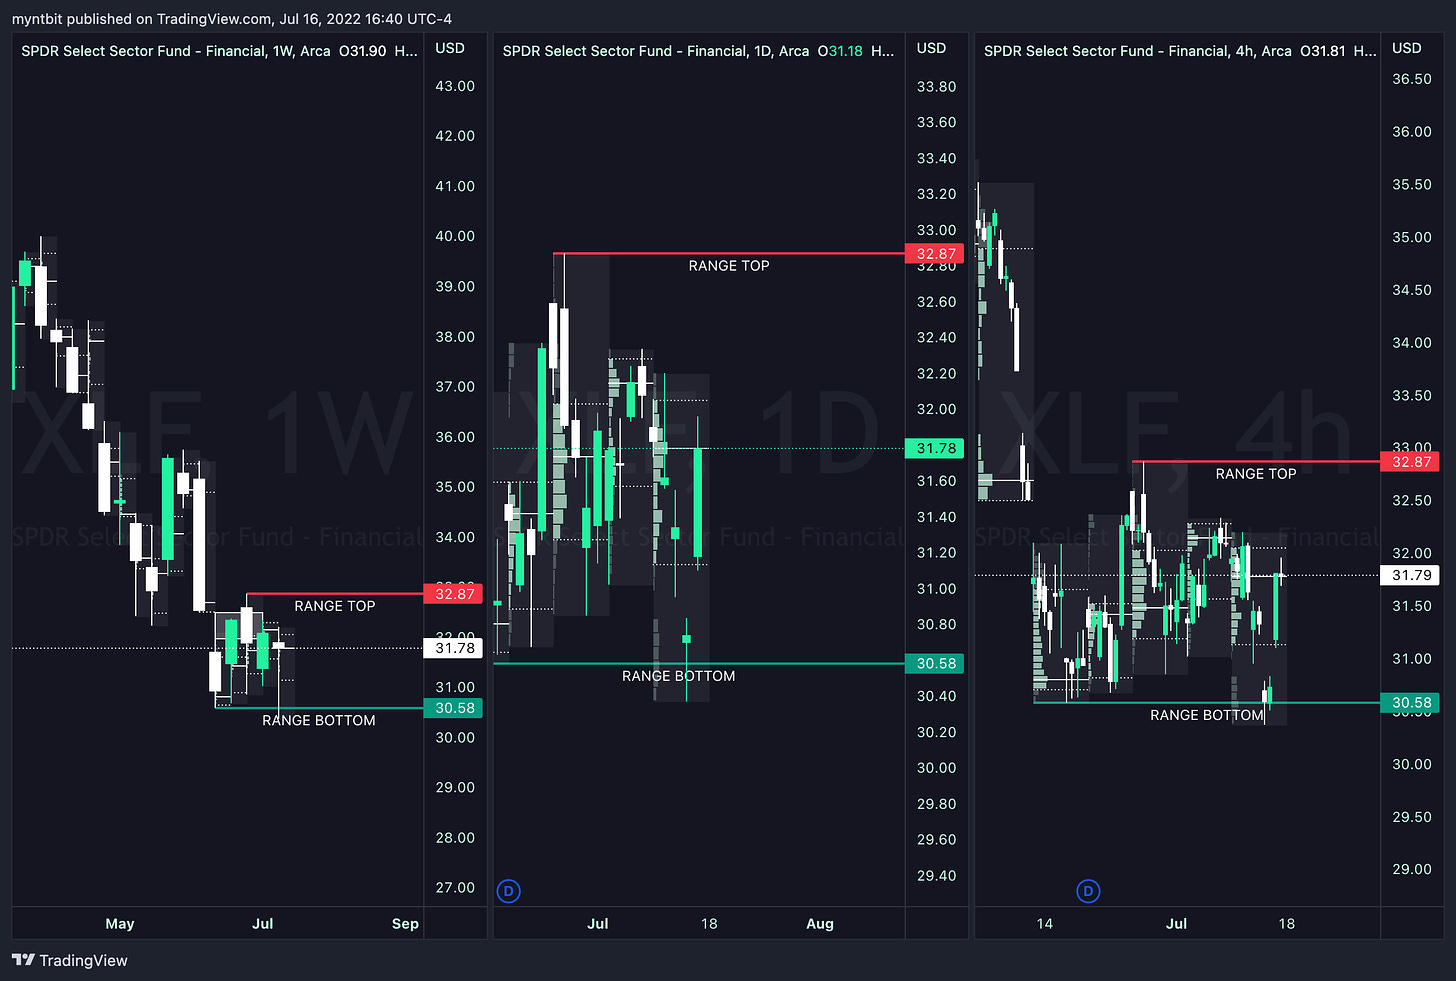
XLF - Financial Select Sector SPDR Fund
XLF Chart by TradingView
XLF has had an eventful week, as banks kicked off earnings. JPM and GS started off rough on Thursday but Citi and Wells Fargo helped the sector recover stayed on Friday. There are still earnings coming up that could impact the sector further next week so expect volatility.
Bull Case - We did find buyers at the range lows near 30.37 so to see further upside, the resistance at 32.33 needs to power us to test the range high of 32.87. Something to note is that there is a gap at 33.75 that needs to be filled.
Bear Case - The move on Friday after the test of range low left a gap down at 30.86 that needs to be filled, but bears have a lot of work to do. The sellers did come in at the highs on Friday but more sellers could come in at 32.33 levels.
POC: 31.78
VAH: 32.04 | VAL: 31.13
Range: 30.58 - 32.87
XLE - Energy Select Sector SPDR Fund
XLE Chart by TradingView
XLE has been suffering due to the current headlines on inflation, recession, and oil supply with the Dollar staying strong but a bounce could be in play but not yet.
Bull Case - For bulls Crude oil needs to get over 100 again. The price action for last week was good, as we bounced off the lows. The next resistance that needs to be overcome is 72.28.
Bear Case - Further downside might be limited with the recent moves in the oil and energy sector, risk and reward are limited. There is a support at 59.89 but the range low needs to be talked out.
POC: 68.60
VAH: 70.32 | VAL: 67.88
Range: 65.48 - 76.99
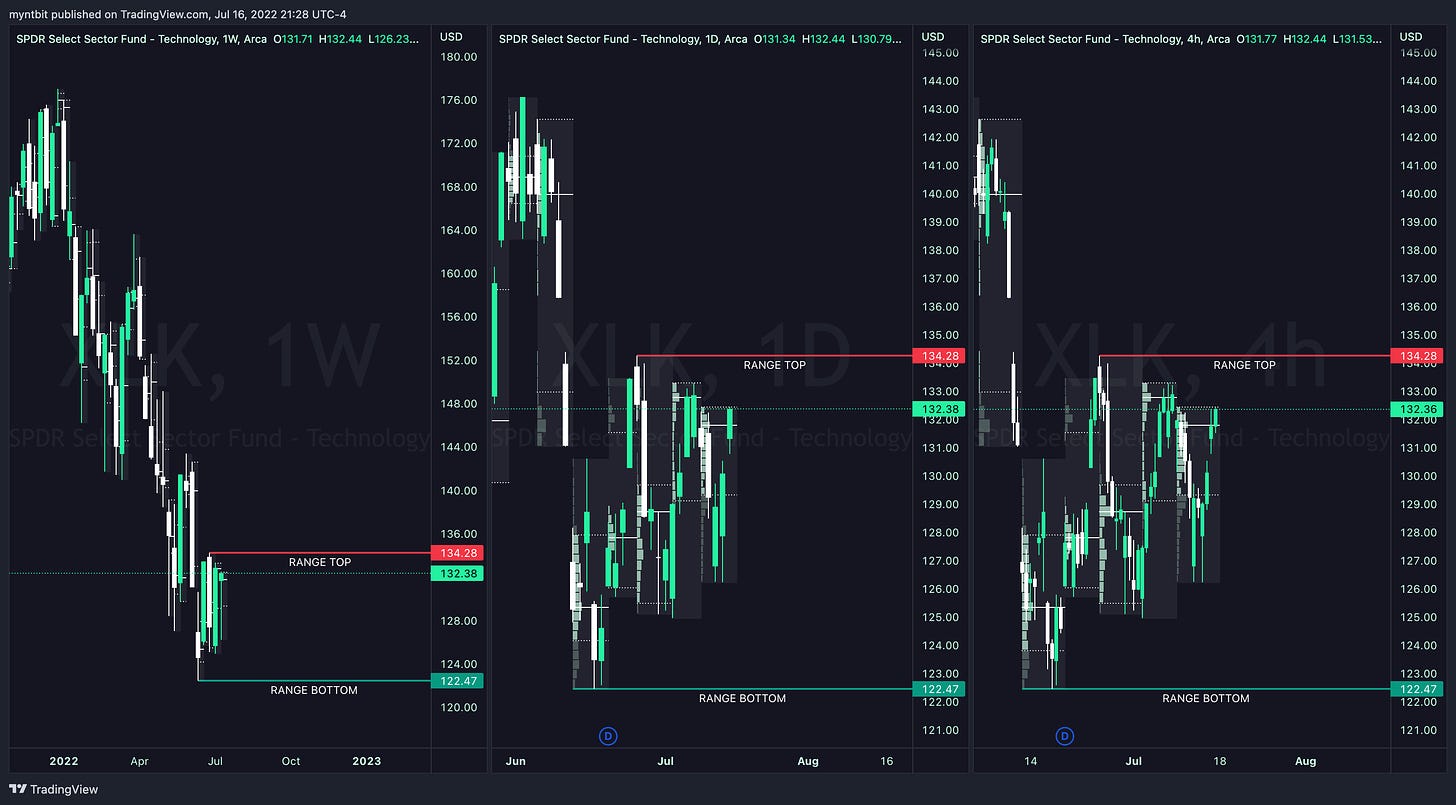
XLK - Technology Select Sector SPDR Fund
XLK Chart by TradingView
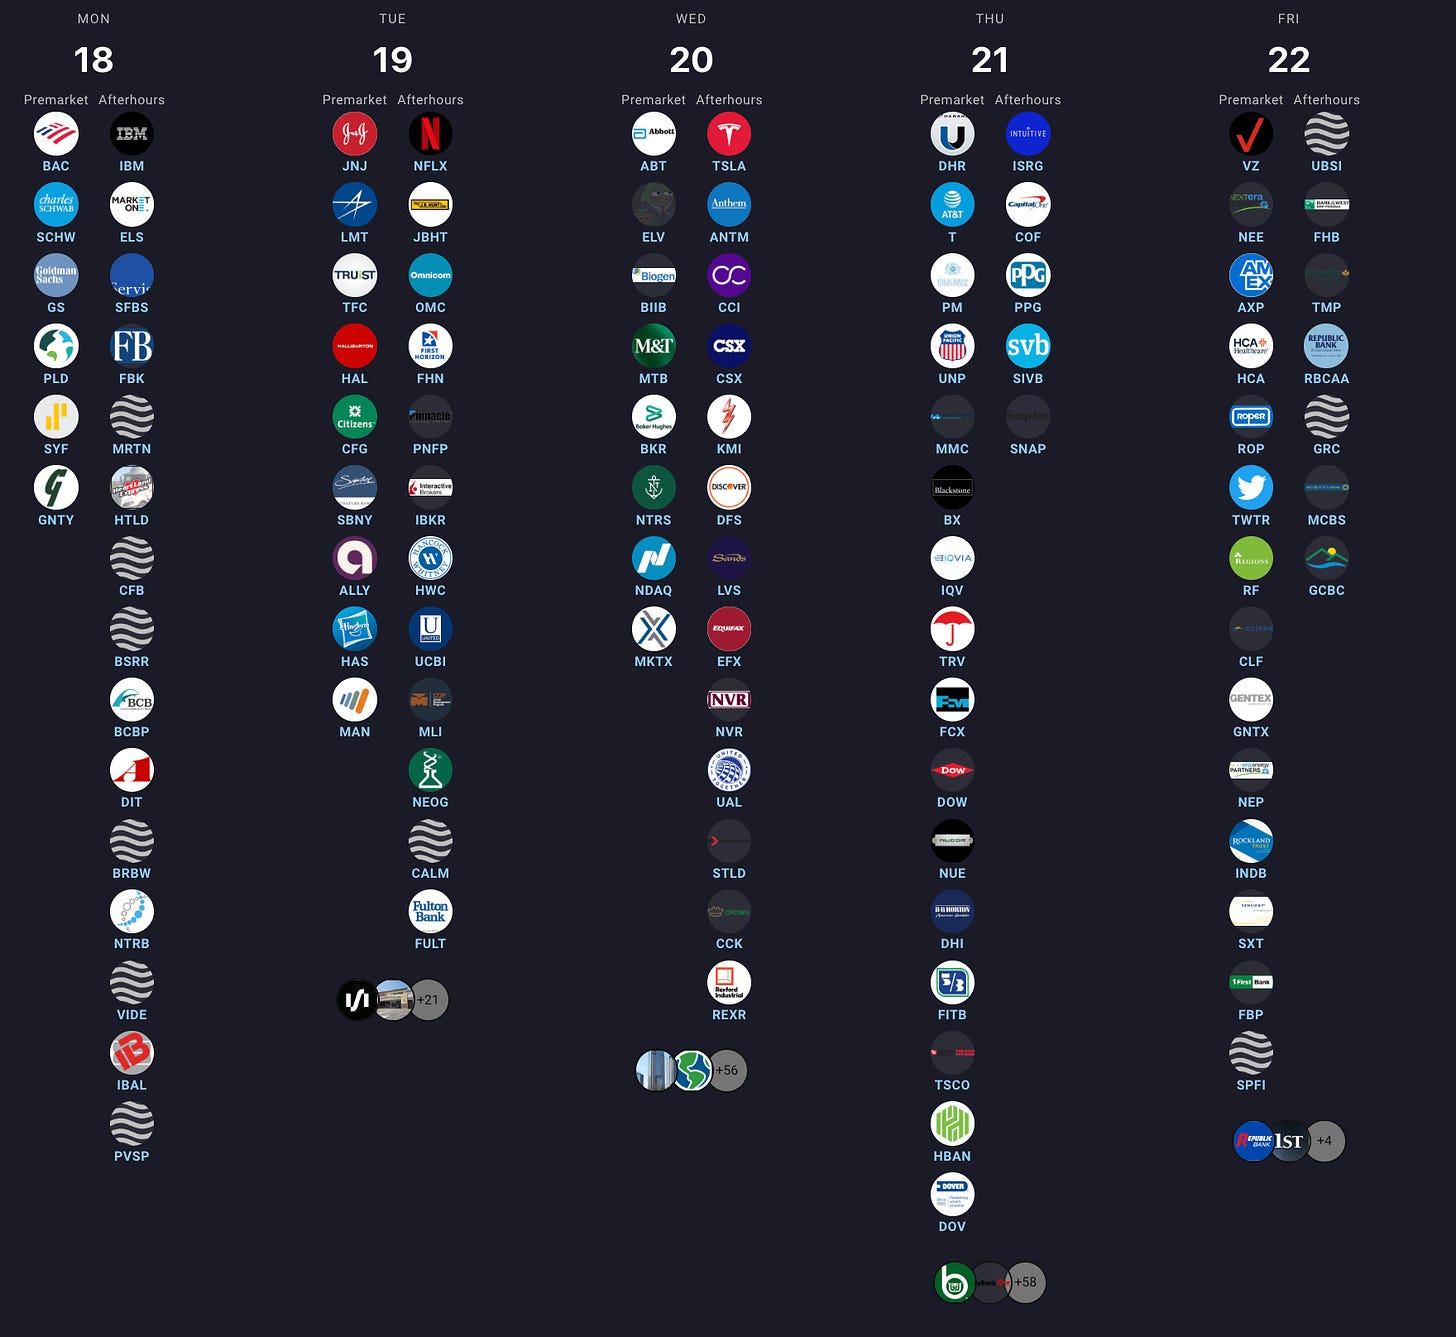
XLK has an inside day on a weekly time frame but the move up from lows showed the strength. The coming weeks are when the real fun begins with some major earnings from companies like TSLA, NFLX and TWTR followed by AAPL, MSFT, and NVDA.
Bull Case - The earnings will determine the moves here, to see any further upside 134.28 needs to be tested and broken.
Bear Case - To see a further downside there needs to be some horrible earnings, 129.38 needs to be broken and then 122.47 low of the range needs to be taken out.
POC: 131.87
VAH: 132.51 | VAL: 129.38
Range: 122.47 - 134.28
Earnings Calendar
Economic Calendar
Disclaimer: This newsletter is not trading or investment advice, but for general informational purposes only. This newsletter represents our personal opinions which we are sharing publicly for educational purposes. Futures, stocks, bonds trading of any kind involves a lot of risk. No guarantee of any profit whatsoever is made. In fact, you may lose everything you have. So be very careful. We guarantee no profit whatsoever, You assume the entire cost and risk of any trading or investing activities you choose to undertake. You are solely responsible for making your own investment decisions. Owners/authors of this newsletter, its representatives, its principals, its moderators and its members, are NOT registered as securities broker-dealers or investment advisors either with the U.S. Securities and Exchange Commission, CFTC or with any other securities/regulatory authority. Consult with a registered investment advisor, broker-dealer, and/or financial advisor. Reading and using this newsletter or any of my publications, you are agreeing to these terms. Any screenshots used here are the courtesy of Finviz, Google Finance, and/or Tradingview. We are just an end-user with no affiliations with them.

