01.16.2023 | Market Trader Vol. 2 Issue 3
Market Trader's Weekly Newsletter brings potential swing setups with a time horizon from days to months depending on price action. The following research is based on Fundamentals & Technical Analysis.
What is included in this week's edition?
WEEKLY REVIEW & LOOKING AHEAD - An overview of current market standing, fundamental matters with implications upon the market, and general sentiment regarding the major US indices. Key takeaways to be mindful of as we look forward to the upcoming trading week.
FUTURES & COMMODITIES MARKETS - A technical review of the major indices, futures, and commodities that represent the overall health of the market.
Briefing's Weekly Review
The stock market has started 2023 on a decidedly strong note. This week looked a lot like last week with the main indices logging decent gains on the basis that the Fed won't have to raise rates as much as feared and that the U.S. economy may see a "soft landing" after all.
Market participants settled into a wait-and-see style trade in the first half of the week in front of Fed Chair Powell's speech on Tuesday, the December Consumer Price Index (CPI) on Thursday, and bank earnings reports on Friday that marked the official start to the Q4 earnings reporting season.
Fed Chair Powell gave a speech titled "Central Bank Independence" Tuesday morning. Investors may have felt emboldened because Mr. Powell did not purposely kill the market's rebound activity in his speech. He did, however, acknowledge that, "...restoring price stability when inflation is high can require measures that are not popular in the short term as we raise rates to slow the economy."
The latter point notwithstanding, the S&P 500 was able to close above technical resistance at its 50-day moving average.
By Thursday's open, market participants were digesting the much-anticipated December CPI report. It was in-line with the market's hopeful expectations that it would show continued disinflation in total CPI (from 7.1% year/year to 6.5%) and core CPI (from 6.0% year/year to 5.7%).
Those were pleasing headline numbers, but it is worth noting that services inflation, which the Fed watches closely, did not improve and rose to 7.5% year/year from 7.2% in November.
That understanding did not seem to hold back the stock or bond market. The price action in those markets on Thursday generally supported the view that the Fed will pause its rate hikes sooner rather than later. In fact, the fed funds futures market now prices in a 67.0% probability of the target range for the fed funds rate peaking at 4.75-5.00% in May versus 55.2% a week ago, according to the CME FedWatch Tool.
The positive price action in the stock market was particularly notable considering the big move leading up to the CPI report. The S&P 500 was up 3.7% for the year entering Thursday and up 4.4% from its low of 3,802 on January 5.
When Friday's trade began, though, market participants decided to take some profits following the big run. Ahead of the open, Bank of America (BAC), JPMorgan Chase (JPM), Wells Fargo (WFC), and Citigroup (C) reported mixed quarterly results relative to expectations that featured increased provisions for credit losses. Those stocks languished out of the gate, as did the broader market, but true to form so far in 2023, buyers returned and bought the weakness. Before long the bank stocks were back in positive territory and so was the broader market.
The S&P 500 moved above its 200-day moving average (3,981) on the rebound trade and closed the week a whisker shy of 4,000.
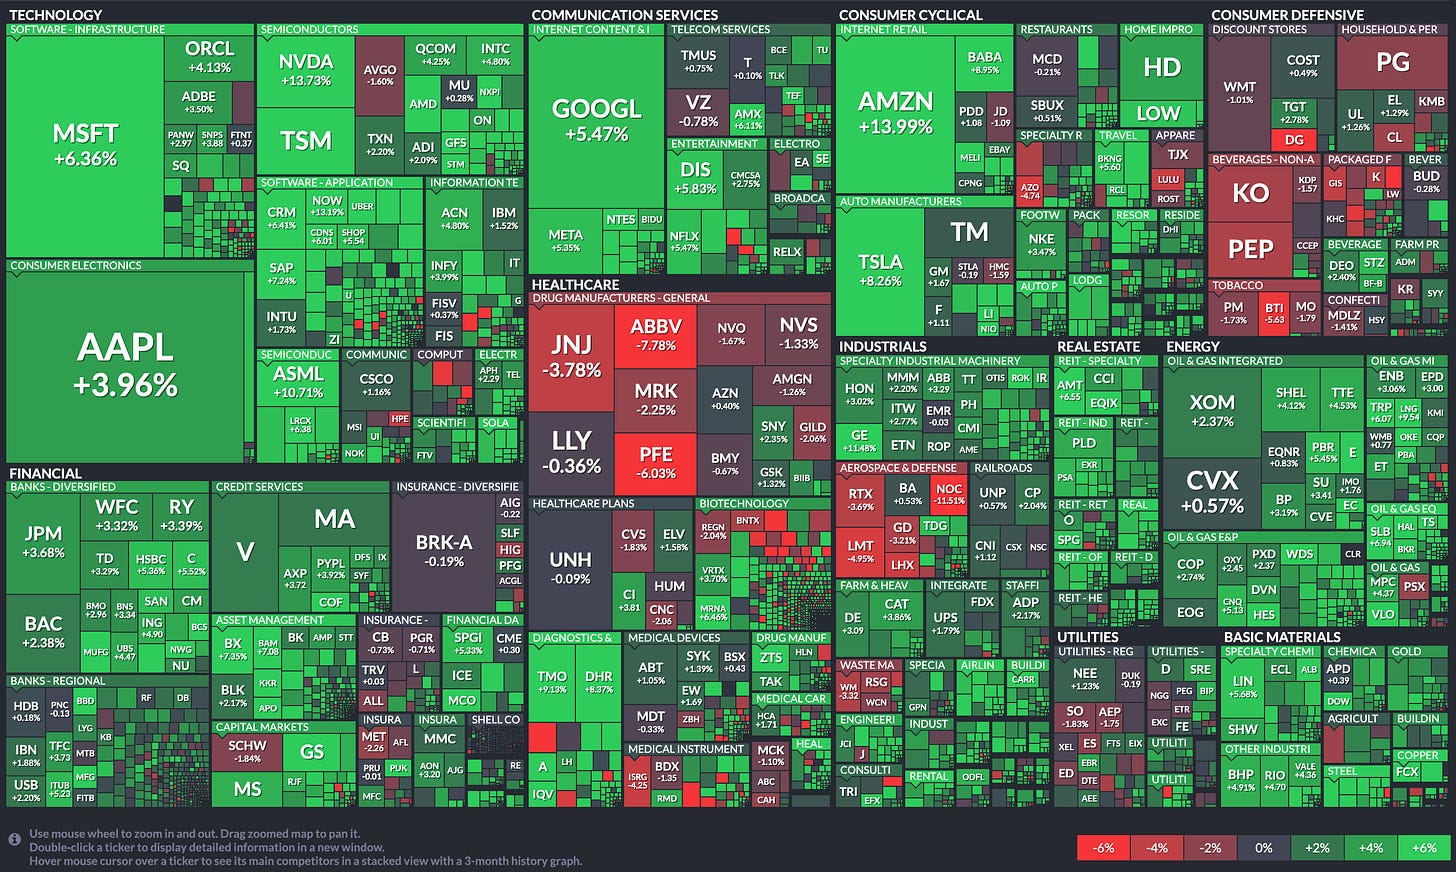
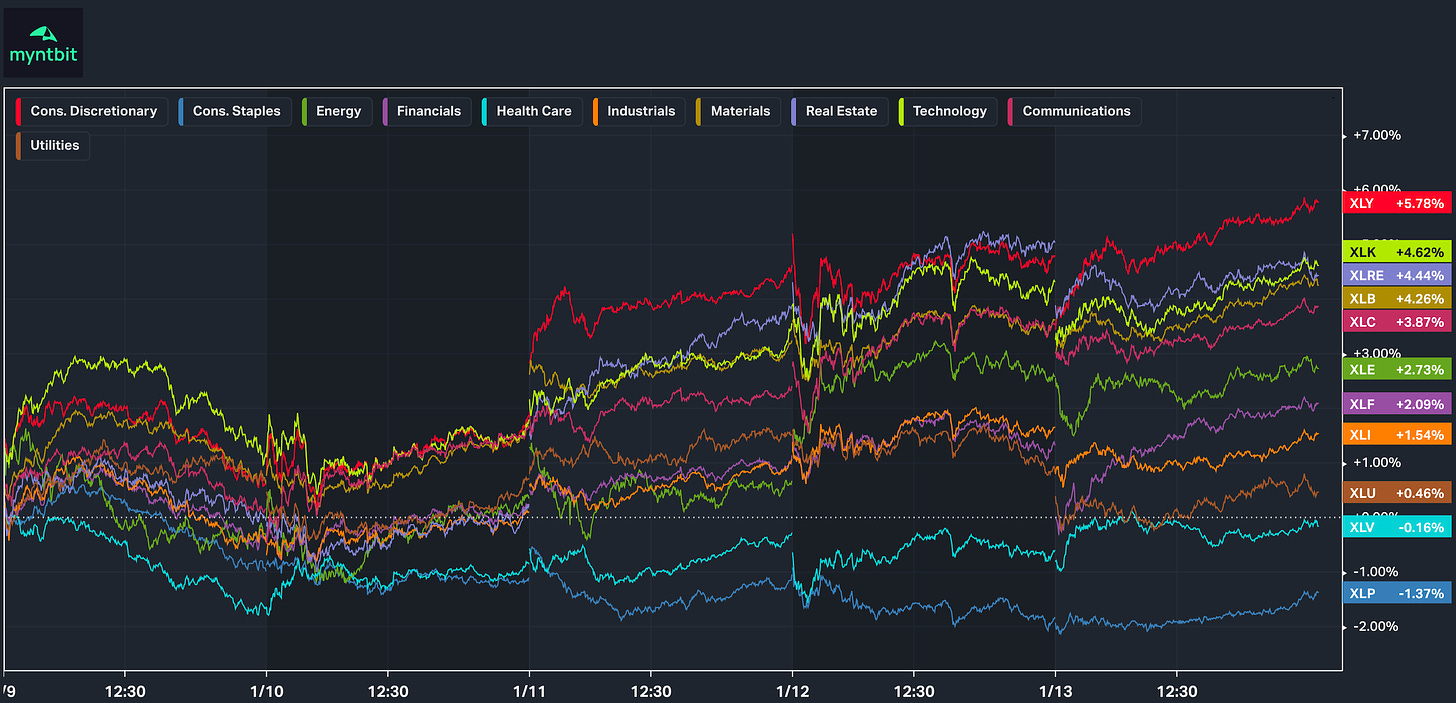
Only two of the S&P 500 sectors closed with a loss this week -- health care (-0.2%) and consumer staples (-1.5%) -- while the heavily weighted consumer discretionary (+5.8%) and information technology (+4.6%) sectors logged the biggest gains.
The 2-yr Treasury note yield fell five basis points to 4.22% and the 10-yr note yield fell six basis points to 3.51%. The U.S. Dollar Index fell 1.6% this week to 102.18.
WTI crude oil futures made strides to the upside this week rising 8.5% to $80.06/bbl. Natural gas futures fell 4.8% to $3.23/mmbtu.
Weekly Market & Sector Performance Heatmap
Looking Ahead
US Stock Market is closed on Monday (Jan 16 2023)
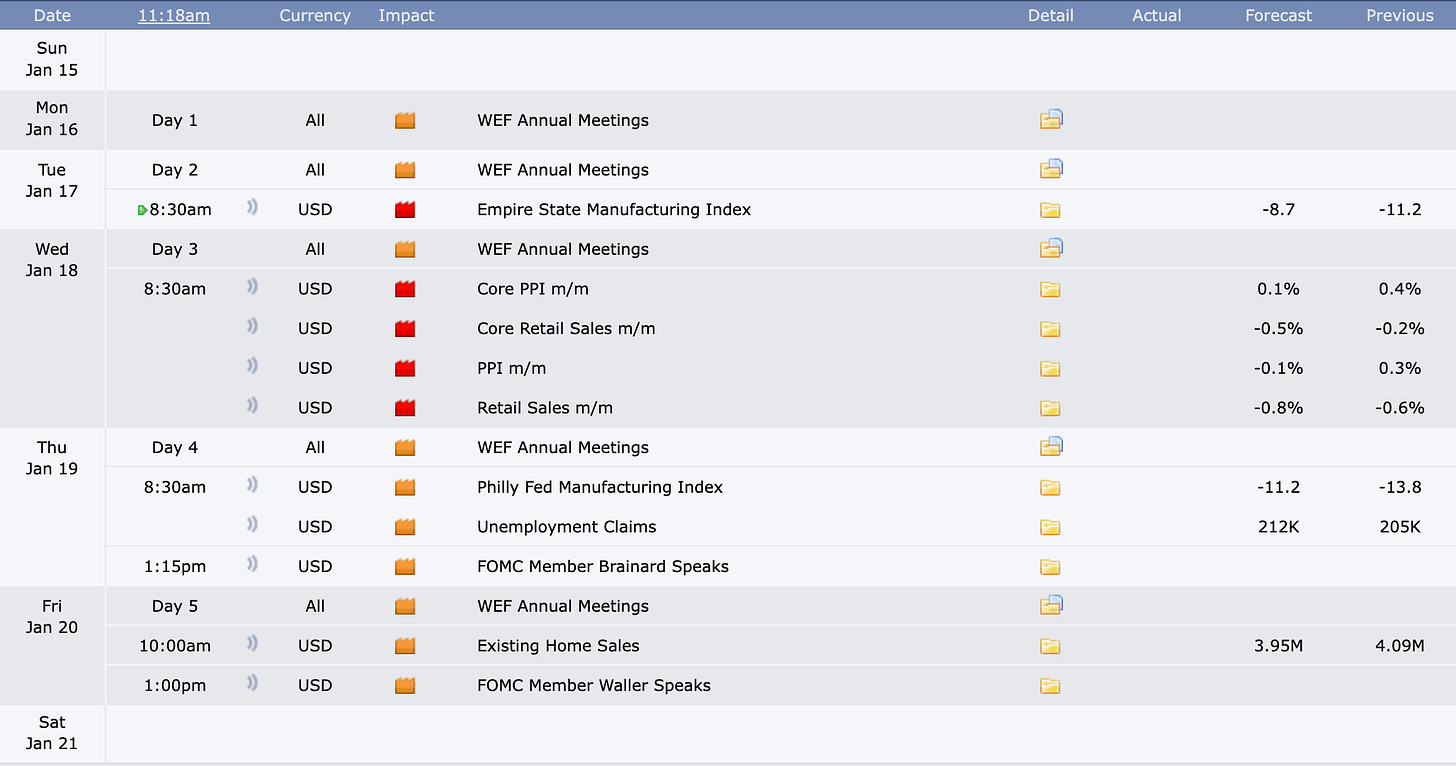
Next week, Wednesday’s update on December’s Producer Price Index (PPI) will headline the docket as investors gauge the future course of interest rate hikes. December’s monthly PPI is forecasted to remain stagnant while core PPI (which excludes the volatile food and energy) is forecasted to ease from last month’s print. Elsewhere, market participants will get a deep dive into January’s housing market from NAHB’s housing market index and December’s housing starts, building permits, and existing home sales.
Internationally, investors can expect the highly watched CPI readings from Japan, the U.K., and the Eurozone. Meanwhile, China is slated to release their fourth quarter annualized Gross Domestic Product (GDP) on Monday, plus an adjustment to their 1- and 5-year loan prime rate on Thursday.
In the central bank sphere, multiple U.S. Fed officials are slated to speak throughout the week, along with European’s Central Bank’s (ECB) policymaker Robert Holzmann, who is slated to speak Thursday morning before the release of the ECB’s December policy meeting notes.
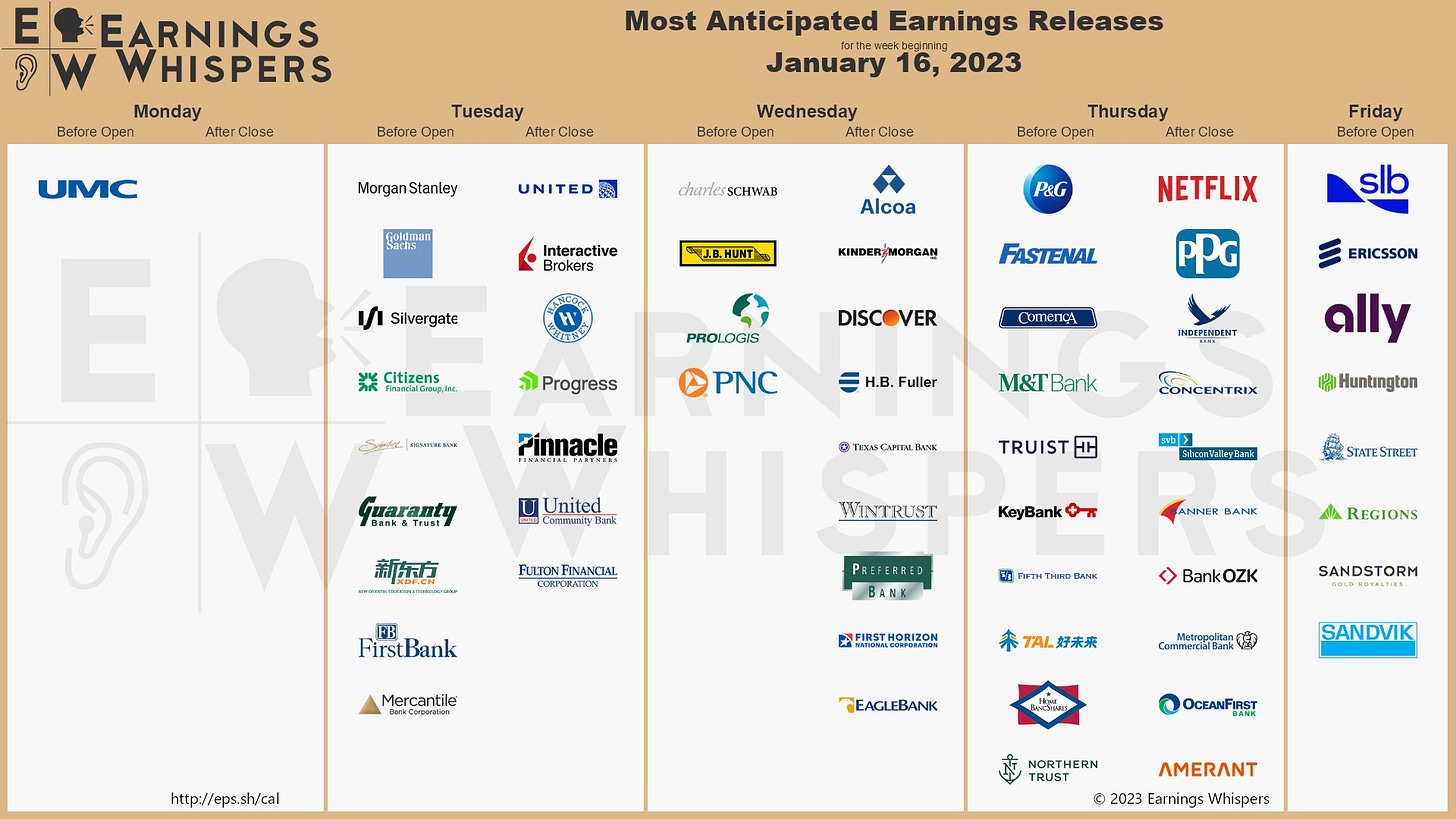
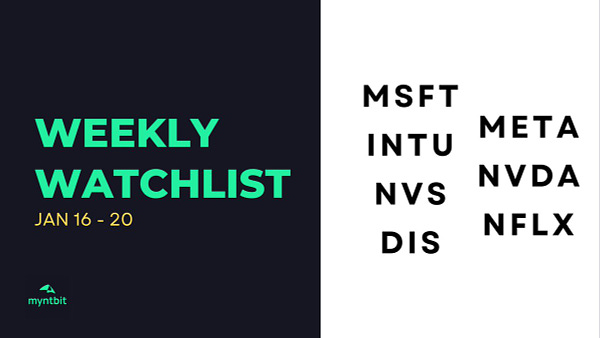
In earnings news, market participants can expect more financial earnings to be reported along with Netflix Inc. and two notable airlines – American Airlines Group Inc. and United Airline Holdings, Inc.
Earnings Calendar
Economical Events
Future & Commodities Markets
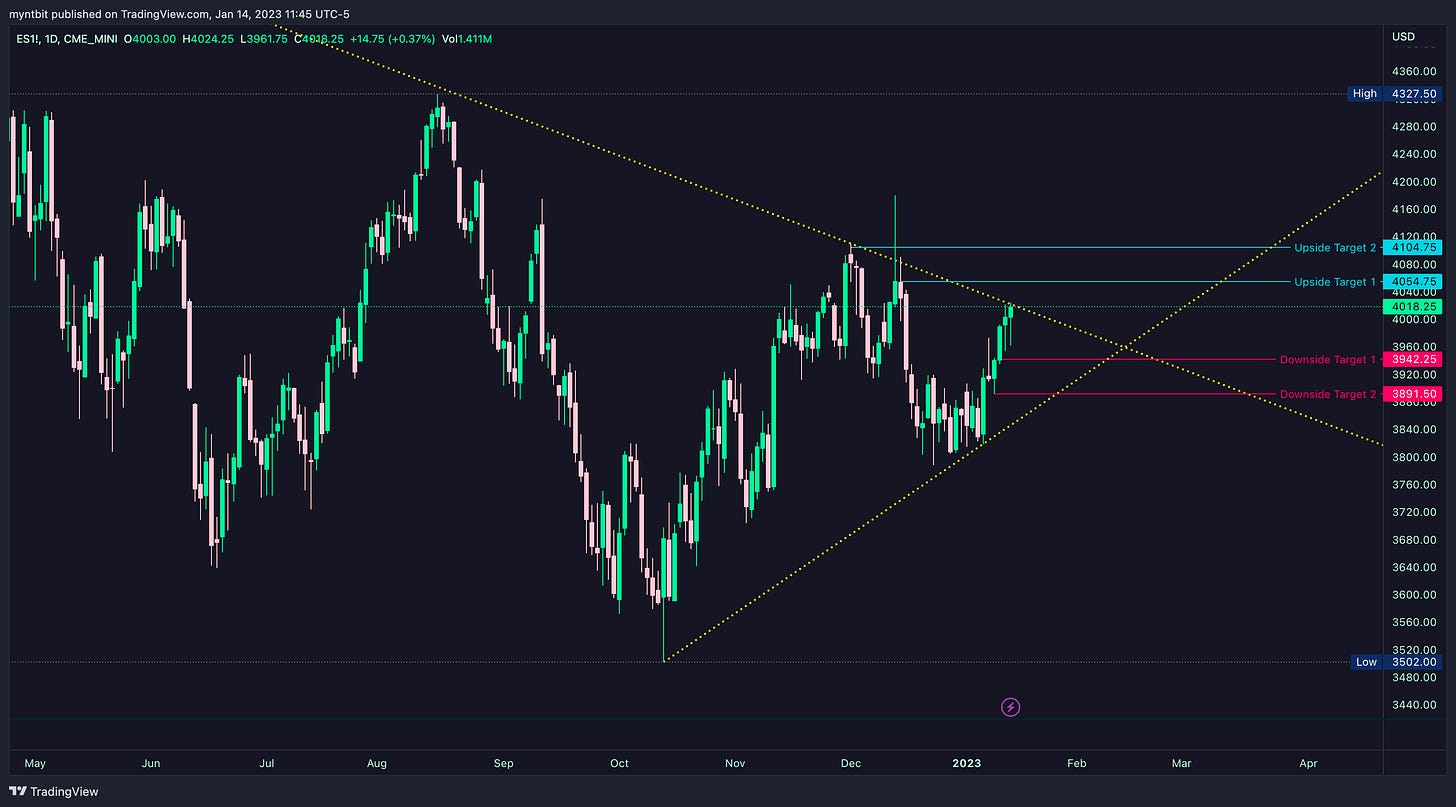
/ES - Emini S&P 500
ES broke out of the consolidation zone and continued its run towards 4000 and closed the gap that was left in mid-Dec. Now it is sitting at a critical level, below are the levels for this week.
Upside: If you hold and stay above the 4000, we could expect to test 4065 and 4100 in the short term.
Downside: If we fail to hold 4000, then we could go down to test the 3952 then 3900.
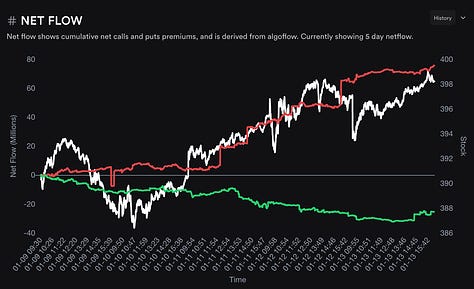
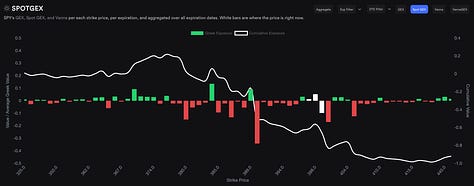
SPY Option Flow

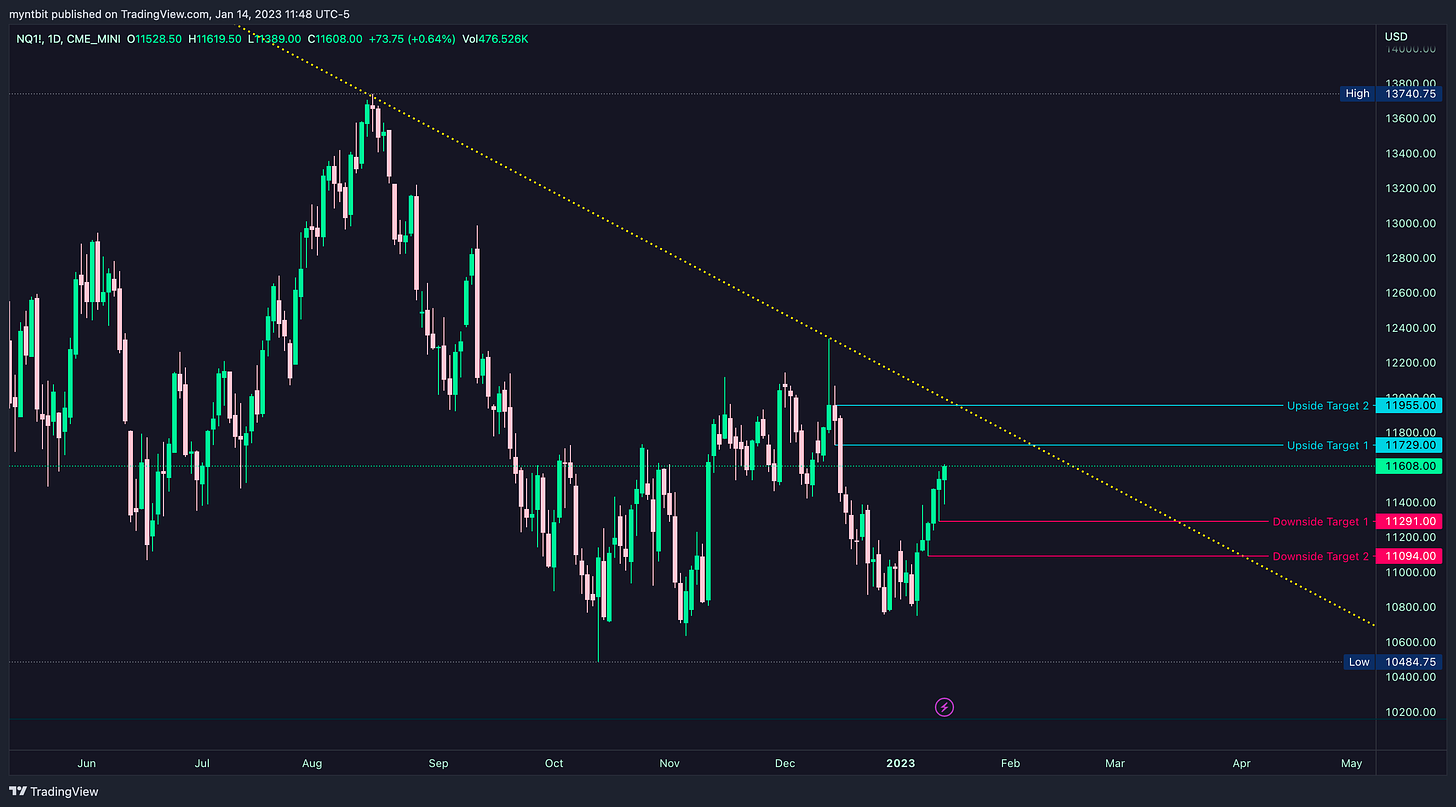
/NQ - Emini Nasdaq 100
Tech stocks led the rally with some strong price action as NQ filled the gap and finished the week at 11600 which was higher than last week’s expected upside move. Now the focus shifts to how far this rally extends.
Upside: If you hold and stay above 11500, then we could test 11700 with a chance of trying to get to 12000.
Downside: If we fail to hold 11500, then we could go down to the range bottom and critical support at 11000.
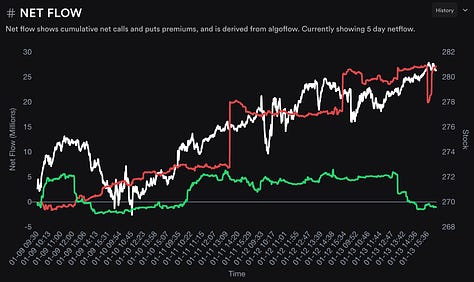
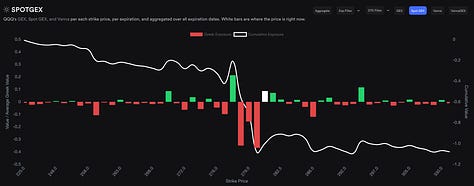
QQQ Option Flow

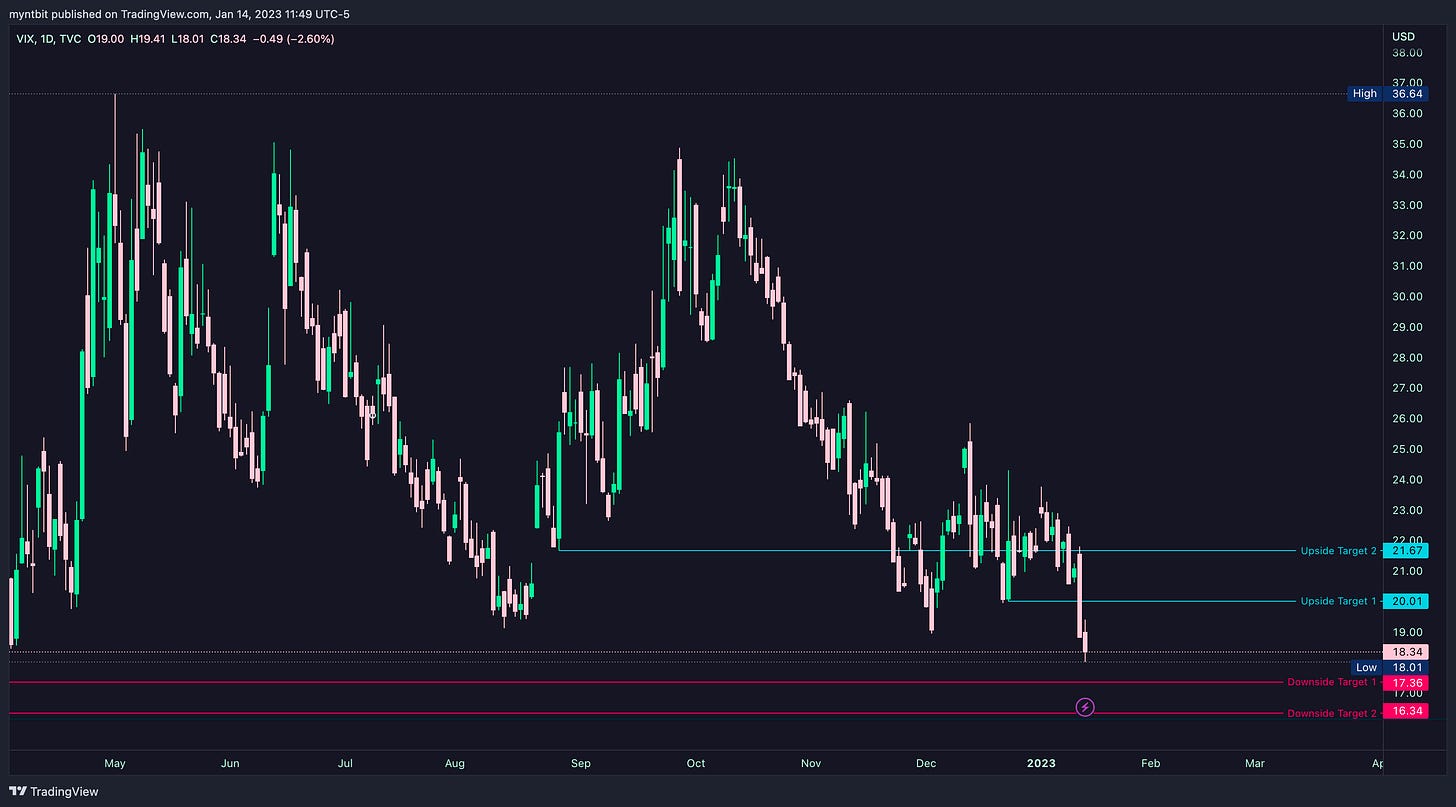
VIX - Volatility Index
VIX took a massive turn after it broke below 20 as it created a new low at 18. This is a critical level for the markets.
Upside: 20.01, 21.67
Downside: 17.36, 16.34

Thank you for reading MyntBit Newsletter. Please share on Twitter!
Disclaimer: This newsletter is not trading or investment advice, but for general informational purposes only. This newsletter represents our personal opinions that we share publicly for educational purposes. Futures, stocks, and bonds trading of any kind involves a lot of risks. No guarantee of any profit whatsoever is made. In fact, you may lose everything you have. So be very careful. We guarantee no profit whatsoever, You assume the entire cost and risk of any trading or investing activities you choose to undertake. You are solely responsible for making your own investment decisions. Owners/authors of this newsletter, its representatives, its principals, its moderators, and its members, are NOT registered as securities broker-dealers or investment advisors either with the U.S. Securities and Exchange Commission, CFTC, or with any other securities/regulatory authority. Consult with a registered investment advisor, broker-dealer, and/or financial advisor. By reading and using this newsletter or any of my publications, you are agreeing to these terms. Any screenshots used here are the courtesy of Briefing.com, ForexFactory, Finviz, Tradytics, Wells Fargo Advisor, and/or Tradingview. We are just end-users with no affiliations with them.
Thanks for reading MyntBit Newsletter! Subscribe for free to receive new posts and support our work.


