01.09.2023 | Market Trader Vol. 2 Issue 2
Market Trader's goal is to bring you potential swing setups with a time horizon from days to months depending on price action. The stock selection is based on Fundamentals & Technical Analysis.
What is included in this week's edition?
WEEKLY REVIEW & LOOKING AHEAD - An overview of current market standing, fundamental matters with implications upon the market, and general sentiment regarding the major US indices. Key takeaways to be mindful of as we look forward to the upcoming trading week.
FUTURES & COMMODITIES MARKETS - A technical review of the major indices, futures, and commodities that represent the overall health of the market.
Briefing's Weekly Review
This last week of the year shaped up to be like most of 2022, disappointing for the stock market. The major indices remained under pressure from continued weakness in some of the most beaten-up names this year. Specifically, mega-cap losses accelerated this week on lingering valuation concerns and presumably tax-loss selling activity by participants who bought into the seemingly invincible stocks last year.
Some of the mega-cap names aren't so "mega" anymore given the massive loss in market capitalization they have suffered this year. The Vanguard Mega Cap Growth ETF (MGK) fell 0.3% this week and 34.0% this year.
The Santa Claus rally period, which encompasses the last five trading days of the year and the first two trading sessions of the new year, has gotten off to an uneven start. It is believed to be a good sign for how the new year will start when this period produces a cumulative gain over that stretch. 2022 was a definite exception to that belief. Recall that the 2021 Santa Claus rally produced a net gain of 1.4% for the S&P 500 and yet the S&P 500 declined 5.3% this January and 5.0% in the first quarter.
It looked like Santa Claus might come charging to town following Thursday's rally. The S&P 500 closed the session just a whisker below the 3,850 level, where it has remained since mid-December, but then backed off again in Friday's trade.
When this year's Santa Claus rally period began, the S&P 500 stood at 3,822.39. The S&P 500 closed Friday's session at 3839.50 after visiting the 3,800 level.
It was also a disappointing week in the Treasury market. The 2-yr note yield rose 10 basis points to 4.42% and the 10-yr note yield rose 13 basis points to 3.88%.
The bump in yields was another headwind for equities, particularly the growth stocks, which was the case all year. The Russell 3000 Growth Index fell 0.3% this week, and 29.6% for the year, versus the Russell 3000 Value Index which rose 0.1% this week and fell 10.1% for the year.
Separately, Southwest Air (LUV) was an individual story stock of note after the airline canceled thousands of flights due to the winter storm. Tesla (TSLA) was another focal point, trading in a roller-coaster fashion. The stock hit 108.76 at its low on Tuesday, leaving it down 69.0% for the year, but managed to rebound and hit a high of 124.48 in Friday's trade.
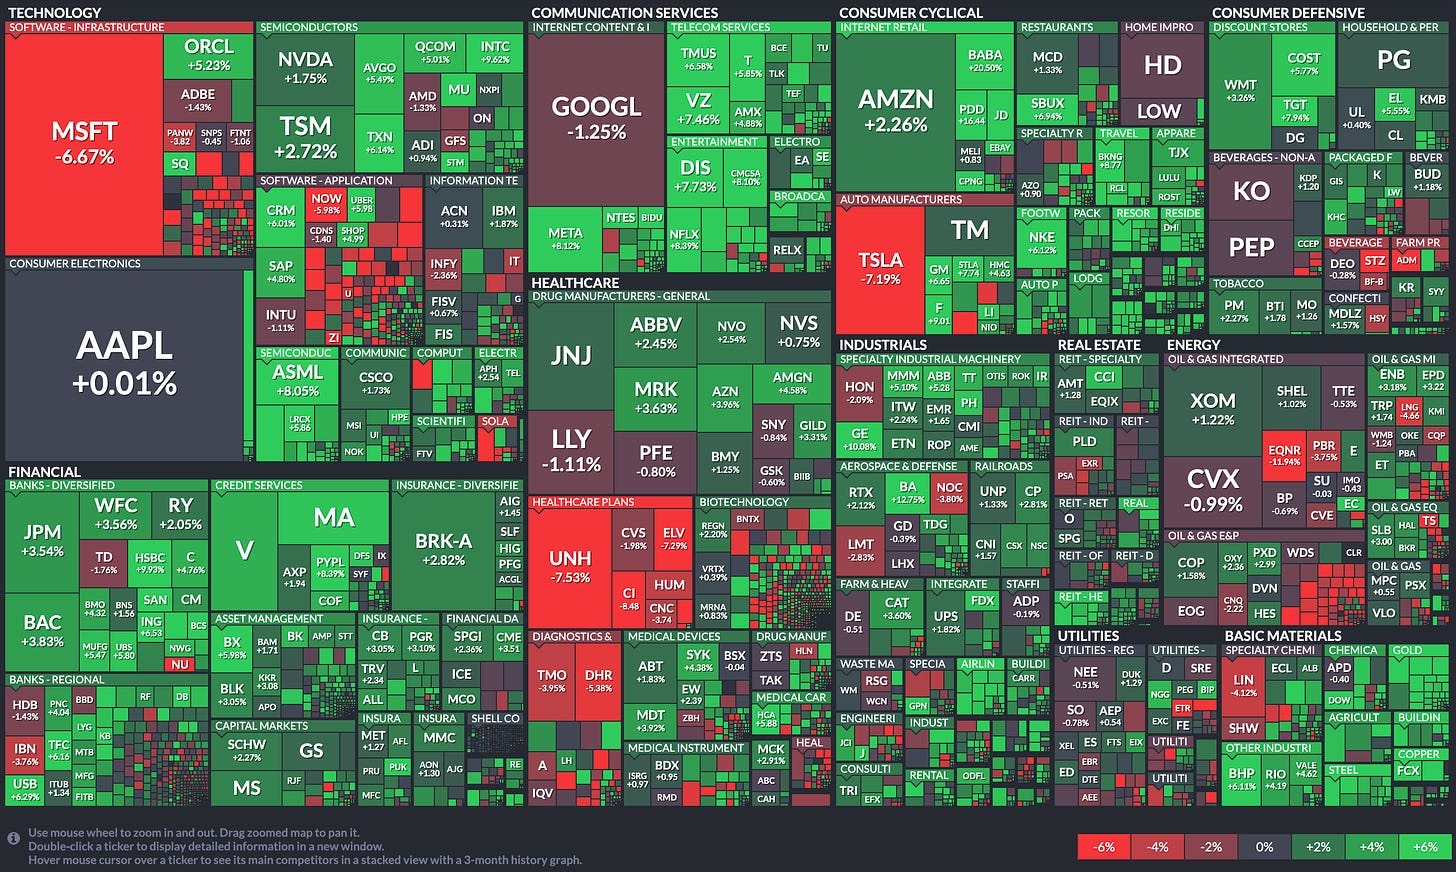
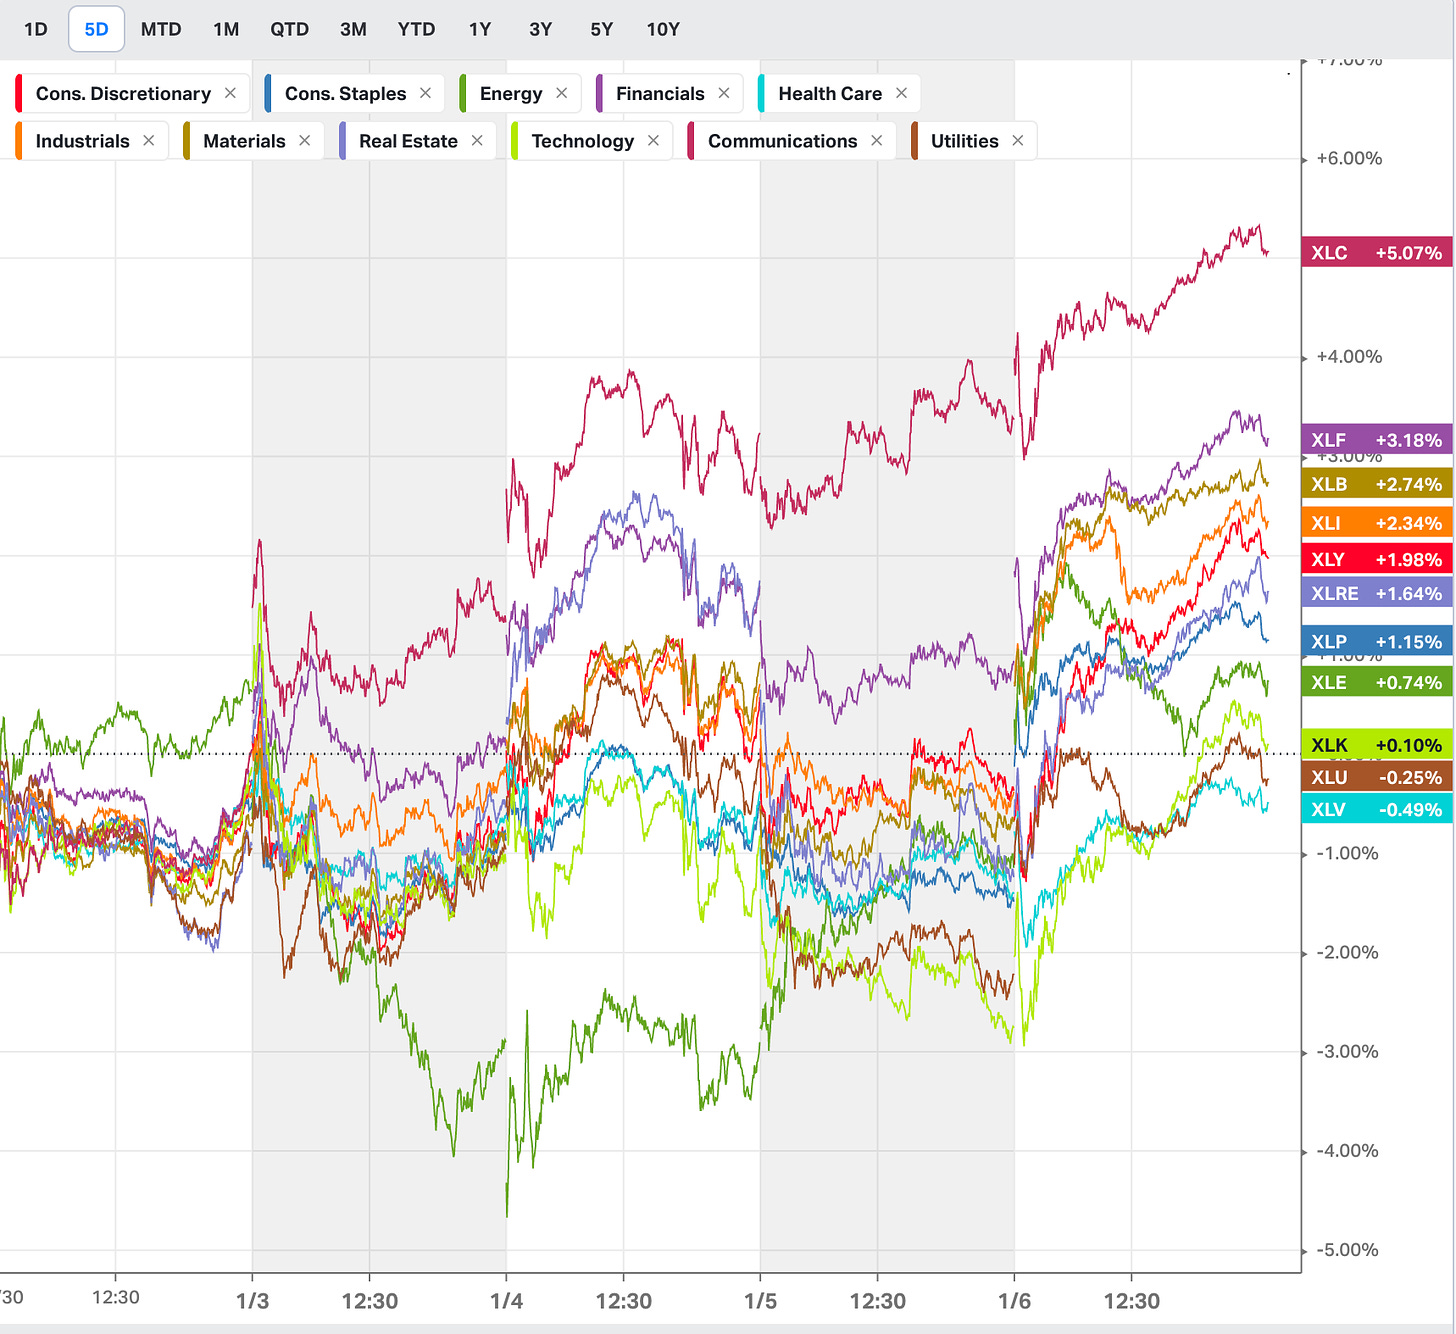
Only two of the 11 S&P 500 sectors closed with a gain this week in thin trading conditions. The financials sector rose 0.7% and the energy sector rose 0.6%, aided by a bump in oil prices above $80.00/bbl. Meanwhile, the materials and consumer staples sectors were the worst performers with losses of 1.2% and 0.9%, respectively.
The economic calendar was light on major releases this week. Featured reports included the November Pending Home Sale Index, which declined 4.0%, and continuing jobless claims for the week ending December 17, which hit their highest level since February (1.710 million). Next week will see a cascade of major releases that includes the December ISM Manufacturing Index, the December Employment Situation Report, and the December ISM Non-Manufacturing Index.
Market & Sector Performance Heatmap
Looking Ahead
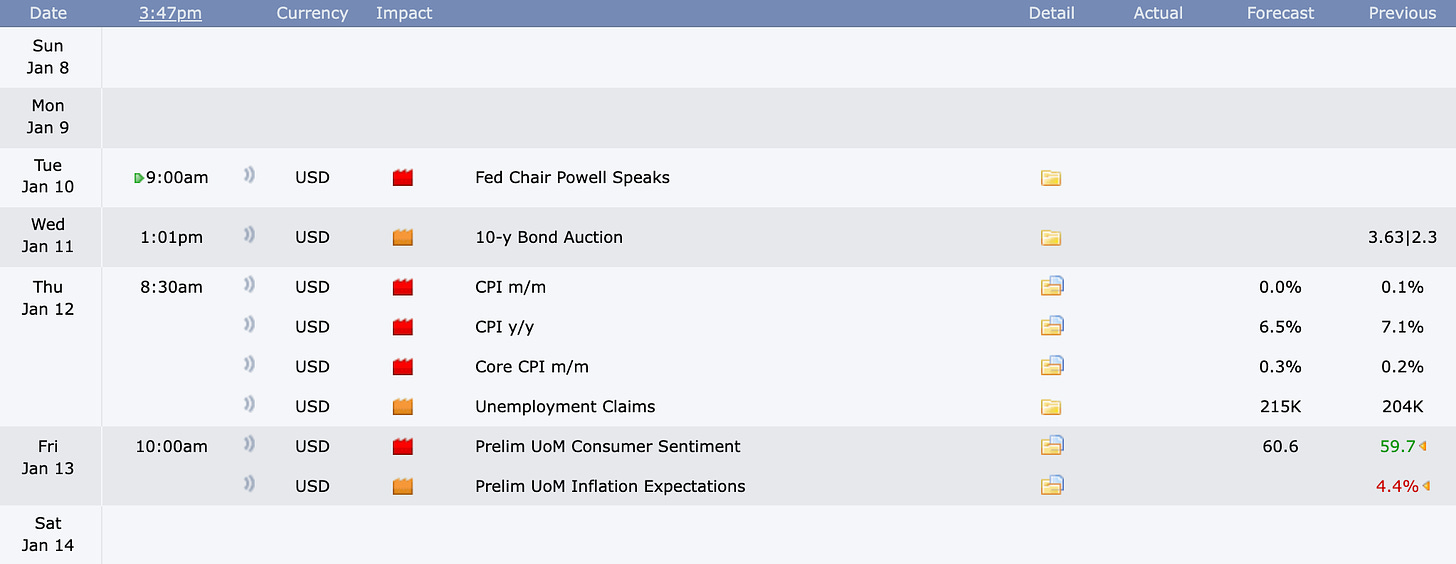
Next week, Thursday’s update on December’s CPI will headline the docket as investors continue to assess the future course of Fed monetary policy. Both the monthly and yearly CPI are forecasted to show a slowdown from November’s print as the Fed’s rate hikes may be limiting inflation’s growth. Market participants will also be focusing on January’s preliminary reading of the University of Michigan’s Consumer Sentiment Index as it assesses consumer attitudes towards personal finances, general business conditions, and market conditions.
Internationally, investors can expect a slew of inflationary data coming in from China, Japan, the U.K., and France. Meanwhile, Germany and China are slated to release December’s year-over-year Gross Domestic Product (GDP) while the U.K. is slated to release December’s monthly GDP.
In the central bank sphere, multiple U.S. Fed officials are slated to speak throughout the week, along with Europe’s central bank policymaker Robert Holzmann, who is slated to speak Wednesday morning.
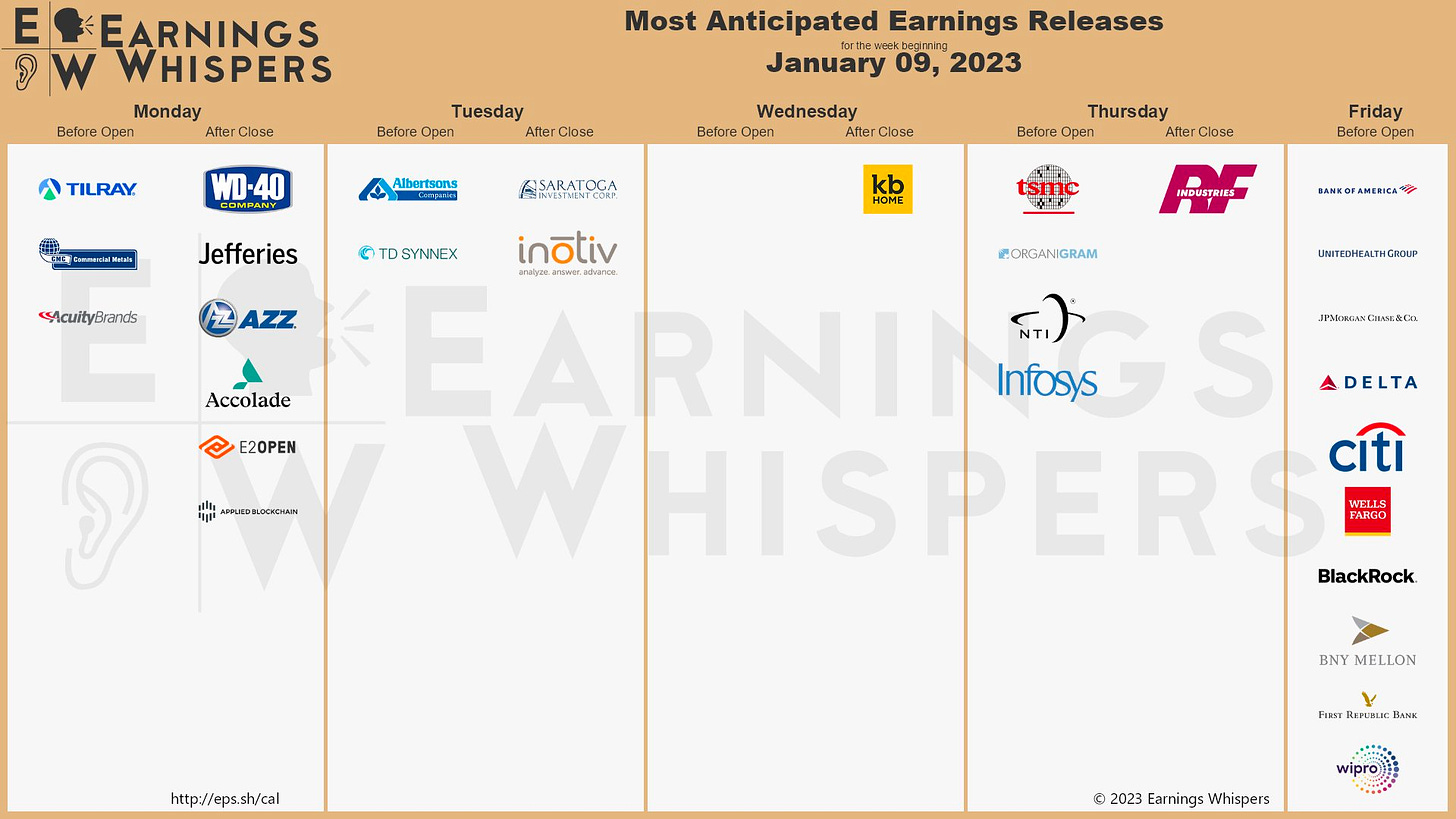
In earnings news, some notable companies reporting this week include major financial institutions, Delta Airlines Inc., and UnitedHealth Group Inc.
Earnings Calendar
Economical Events
Future & Commodities Markets
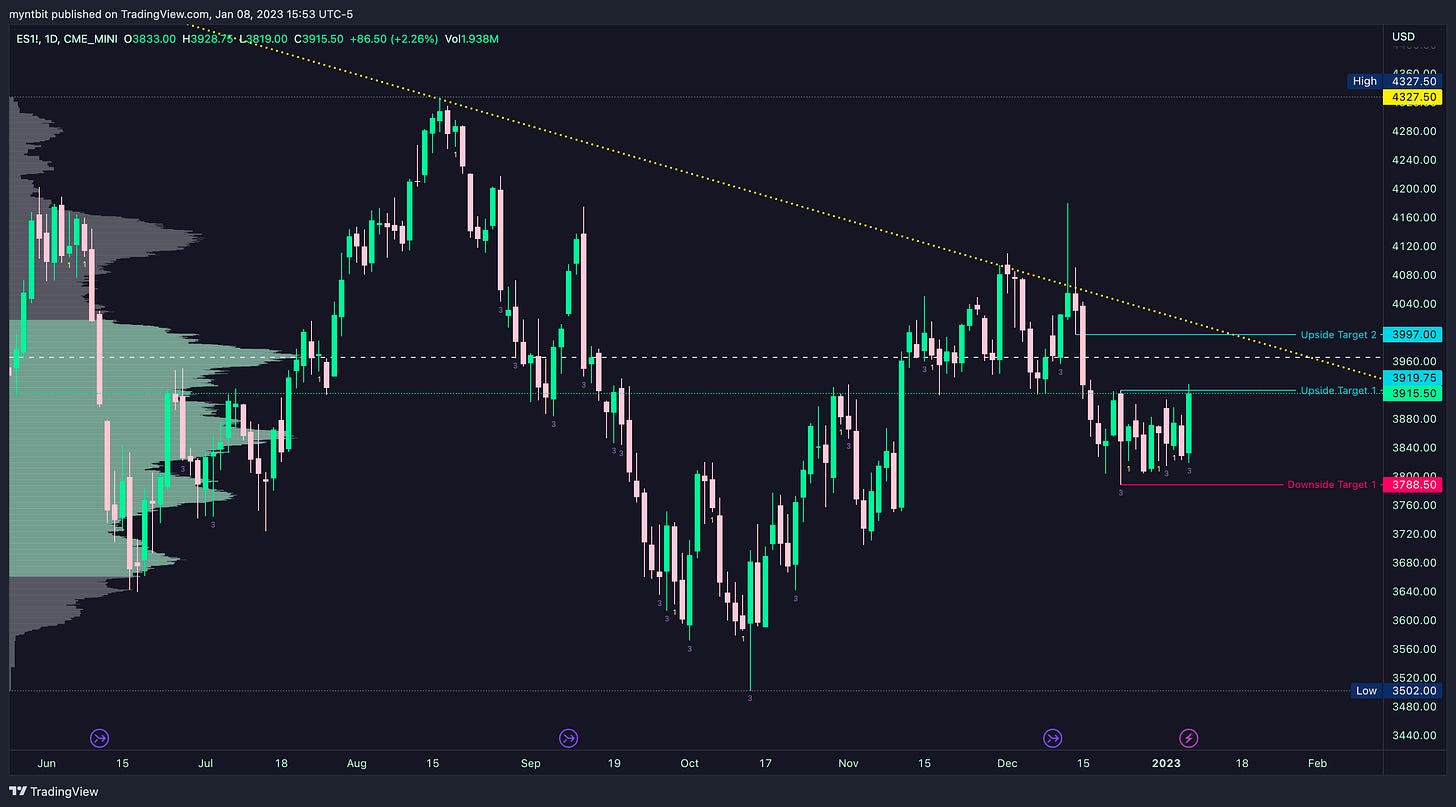
/ES - Emini S&P 500
ES broke towards the top of the range at 3920, below are the levels for this week.
Upside: If you hold and stay above the 3920, we could fill the gap at 3995-4000.
Downside: If we fail to hold 3920, then we could go down to the range bottom at 3800.
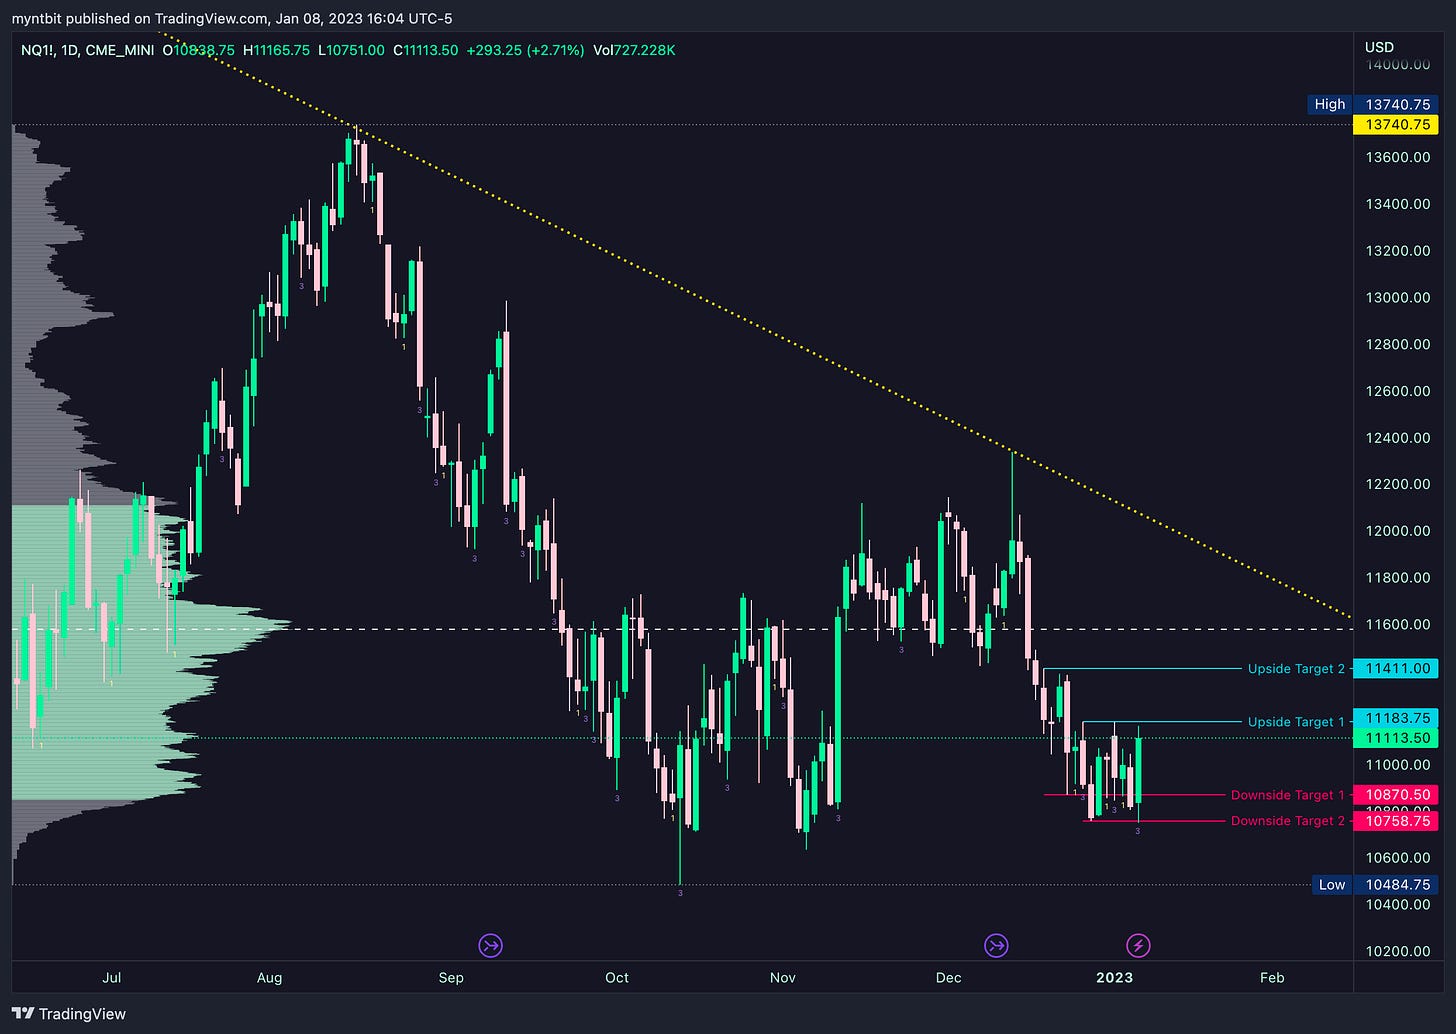
/NQ - Emini Nasdaq 100
Tech stocks have picked up some interest over the past week but with that being said, the levels from last week are still valid.
Upside: If you hold and stay above 11000, then we need to test 11180 to go fill the gap at 11400.
Downside: If we fail to hold 11000, then we could go down to the range bottom at 10800-10750.
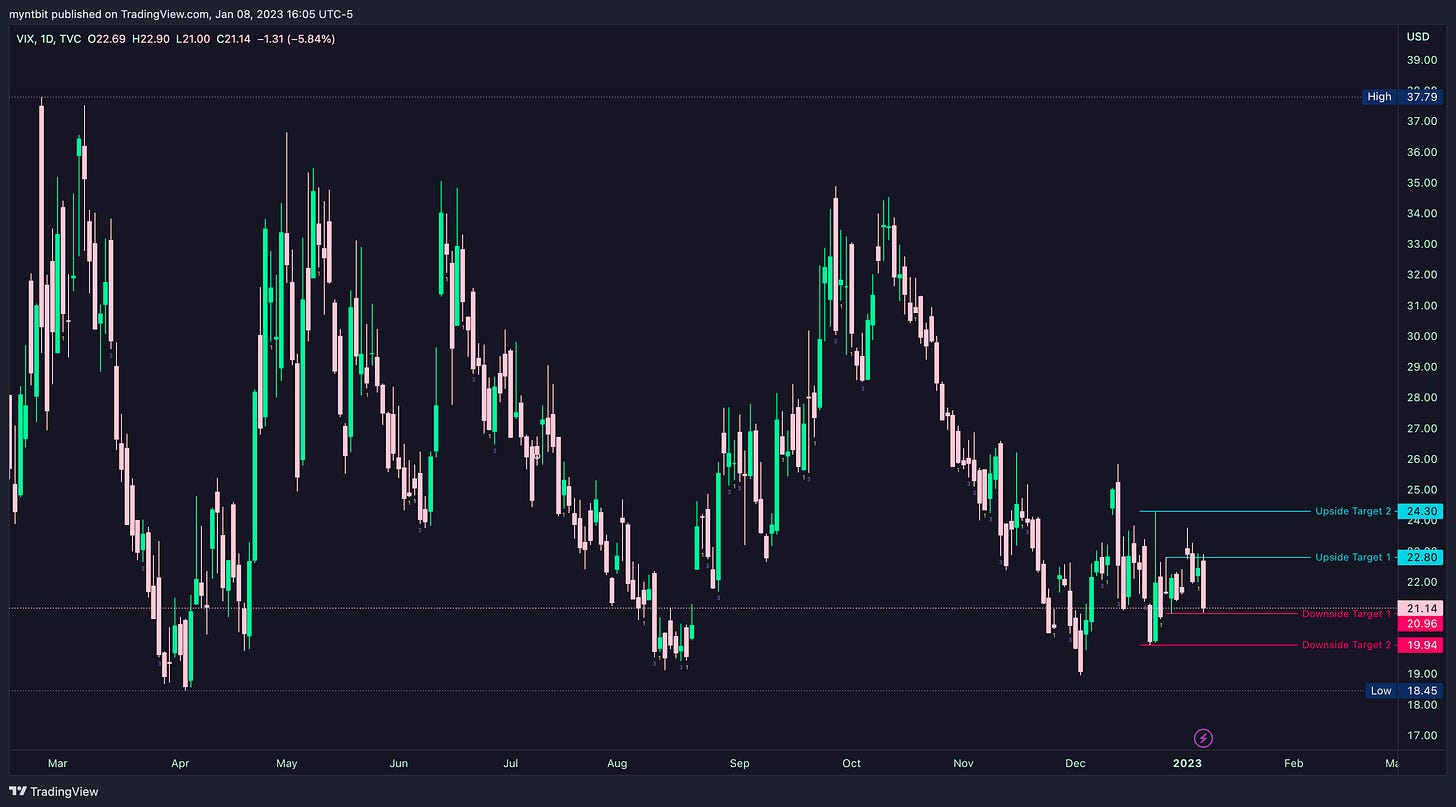
VIX - Volatility Index
VIX even with the multitude of data that were released last week is still coiling between the 20 to 24 range.
Upside: 22.80, 24.30
Downside: 20.96, 19.94
Did you enjoy this post?
If you want more detailed levels and a game plan check out our Discord:
Daily Levels for all the stocks
User stock posts if you want a stock charted with levels, let’s talk about it and create a game plan
Live Streams with Q&A
Thank you for reading MyntBit Newsletter. Please share on Twitter!
Disclaimer: This newsletter is not trading or investment advice, but for general informational purposes only. This newsletter represents our personal opinions which we are sharing publicly for educational purposes. Futures, stocks, and bonds trading of any kind involves a lot of risks. No guarantee of any profit whatsoever is made. In fact, you may lose everything you have. So be very careful. We guarantee no profit whatsoever, You assume the entire cost and risk of any trading or investing activities you choose to undertake. You are solely responsible for making your own investment decisions. Owners/authors of this newsletter, its representatives, its principals, its moderators, and its members, are NOT registered as securities broker-dealers or investment advisors either with the U.S. Securities and Exchange Commission, CFTC or with any other securities/regulatory authority. Consult with a registered investment advisor, broker-dealer, and/or financial advisor. By reading and using this newsletter or any of my publications, you are agreeing to these terms. Any screenshots used here are the courtesy of Briefing.com, FXstreet, Google Finance, Unusual Whale, Refinitiv, and/or Tradingview. We are just end-users with no affiliations with them.
Thanks for reading MyntBit Newsletter! Subscribe for free to receive new posts and support our work.


