Market Trader Report V2#20 | TSLA, SQ & AMZN
MyntBit's Market Trader Report brings potential setups for futures & stocks with a time horizon from days to weeks depending on price action. The following research is based on Fundamentals, Technical & Options Analysis.
What is included in this week's edition?
WEEKLY REVIEW - An overview of current market standing, fundamental matters with implications upon the market, and general sentiment regarding the major US indices.
LOOKING AHEAD - Key takeaways to consider as we look forward to the upcoming trading week.
FUTURES MARKETS - ES, NQ, RTY - A technical review of the major indices, futures, and commodities that represent the overall health of the market.
STOCKS - TSLA, SQ, AMZN - Trends, key levels, and trade targets are identified for individual names presenting potential opportunities in the market.
Market Trader by MyntBit
Weekly Review
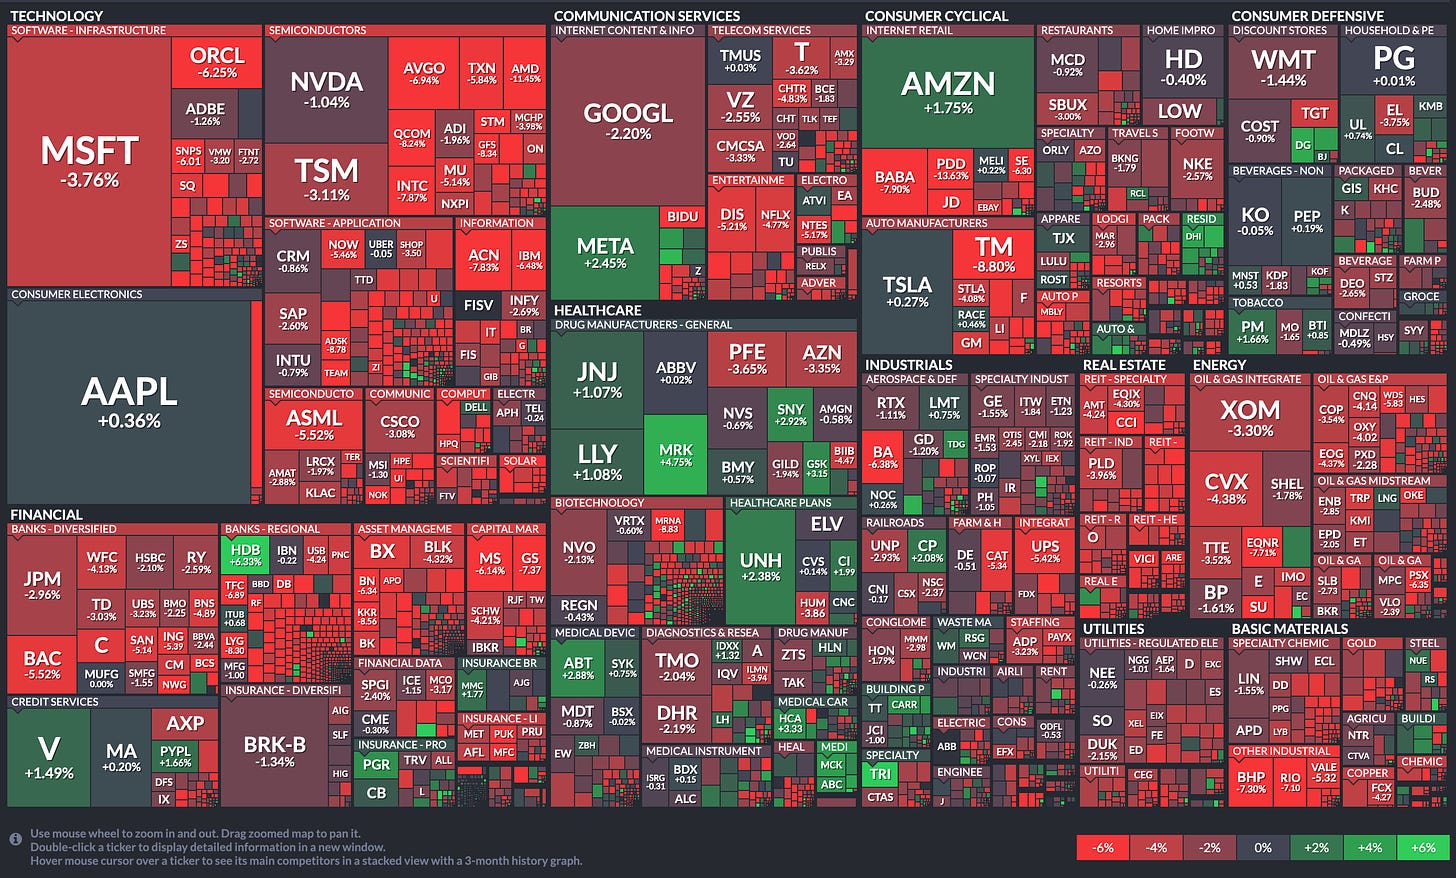
This week of trading, which was shorter due to the holiday, saw the S&P 500 and Nasdaq end their winning streaks. The market experienced a decline as investors took profits after a period of strong growth. While mega-cap stocks performed relatively well, non-tech stocks saw more selling. Concerns about global economic growth and the impact of central bank rate hikes started to affect market sentiment.
During his testimony, Federal Reserve Chair Powell mentioned the possibility of two more rate hikes this year if the economy performs as expected. Fed Governor Michelle Bowman also emphasized the need for additional rate increases to control inflation. Bank stocks were affected by discussions surrounding capital requirements during Powell's testimony.
The underperformance of the Russell 2000 index was driven by weak regional banks and concerns about economic growth. Several central banks, including the Bank of England, Norges Bank, Swiss National Bank, and Central Bank of Turkey, announced rate increases, raising concerns about global inflation and its potential impact on economic growth.
Preliminary manufacturing PMIs for several countries, including Japan, Germany, the UK, the eurozone, and the U.S., indicated contraction in their respective economies. In the U.S., economic data showed declines in existing home sales and the Leading Economic Index, while weekly jobless claims remained high. However, the housing sector outperformed expectations, with strong housing starts.
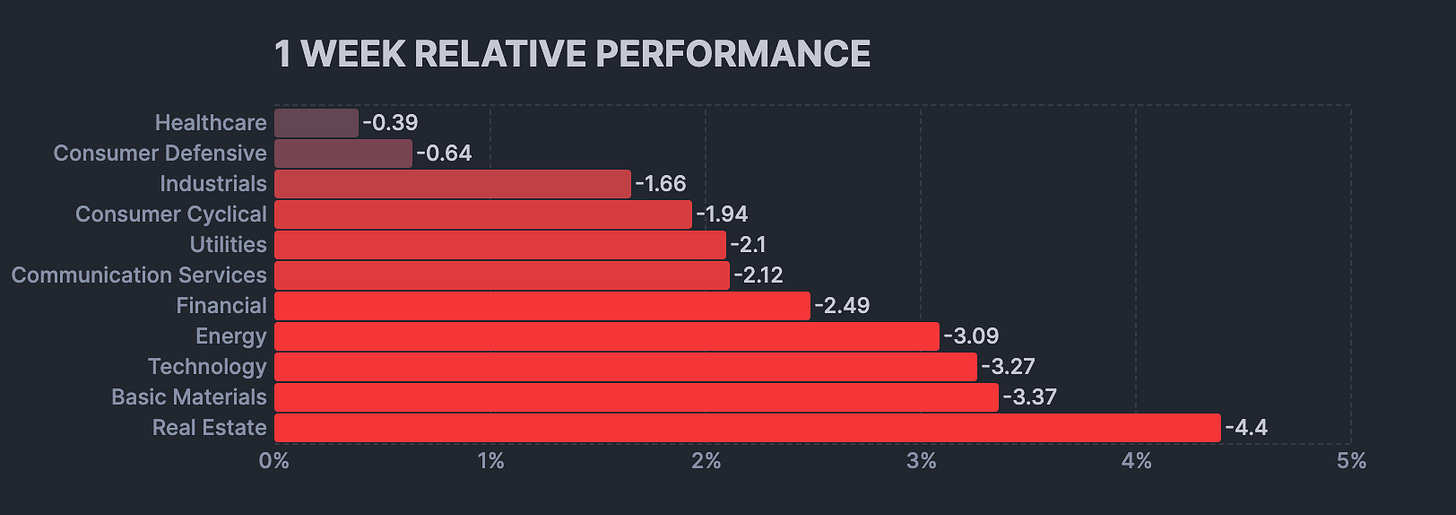
Among the S&P 500 sectors, only healthcare saw gains, while the real estate, energy, and utilities sectors experienced significant declines. Trading volume was exceptionally high on Friday due to the reconstitution of the Russell Indexes.
Weekly Performance Heatmap
Overall Stock Market Heatmap
Sector Performance
Looking Ahead
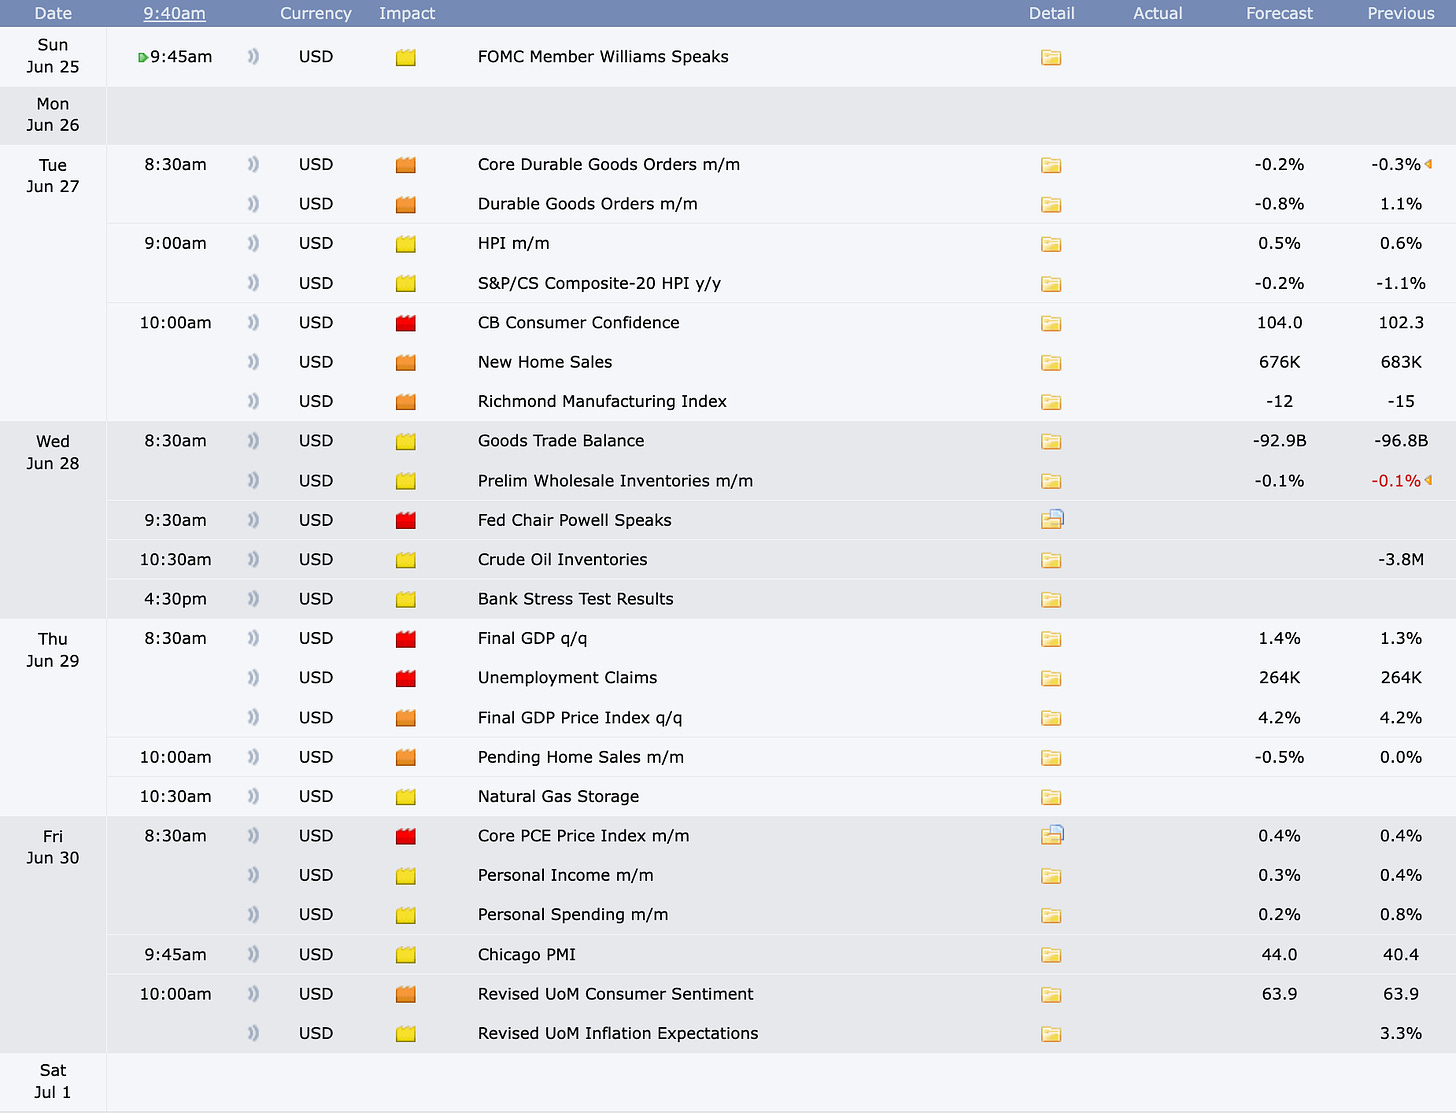
Next week, investors will be closely monitoring various economic indicators and data releases. These include personal spending and income for May, the final reading of first-quarter Gross Domestic Product (GDP), and May's Personal Consumption Expenditures (PCE) Deflator, which is the Federal Reserve's preferred inflation measure.
Additionally, June's Market News International (MNI) Chicago PMI and the Conference Board Consumer Confidence reading will provide insights into economic sentiment. The University of Michigan will also provide a final update on June consumer sentiment and inflation expectations.
Fed Chair Powell will be sharing his policy views at the European Central Bank Forum on Central Banking in Sintra, Portugal. Several other reports are due, including May's durable goods orders, new and pending home sales, and April home price data. The U.S. Treasury Department will conduct auctions for two-, five-, and seven-year securities amounting to $120 billion.
In Asia, attention will be on Chinese manufacturing, services, and composite Purchasing Managers' Index (PMI) data for June, as well as Japan's Tokyo Consumer Price Index (CPI), jobless rate, and preliminary industrial production for May. South Korean industrial production and foreign-trade data for June, along with Australian retail sales and CPI for May, will also be of interest.
In Europe, the focus will be on Eurozone CPI data for June, as well as Germany and France's individual CPI measures. Eurozone money supply and the unemployment rate for May will be released as well. Investors will be watching for the German unemployment change in June and consumer confidence data for France and Germany in June and July, respectively.
Lastly, the week will include the British finalized first-quarter GDP, mortgage approvals for May, and house prices for June.
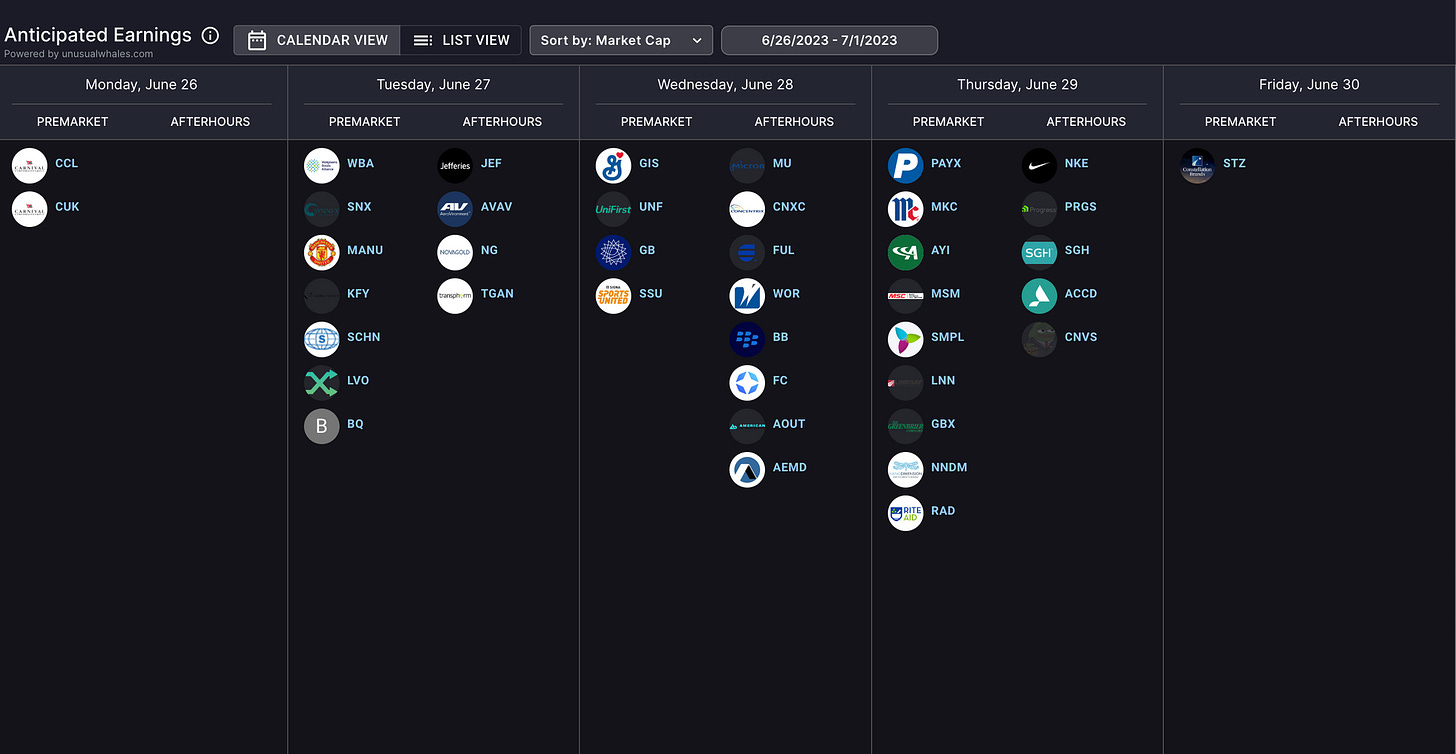
Earnings Calendar
Economical Events
Future & Commodities Markets
Below are the levels for the upcoming week - updates will be provided on Twitter throughout the week.
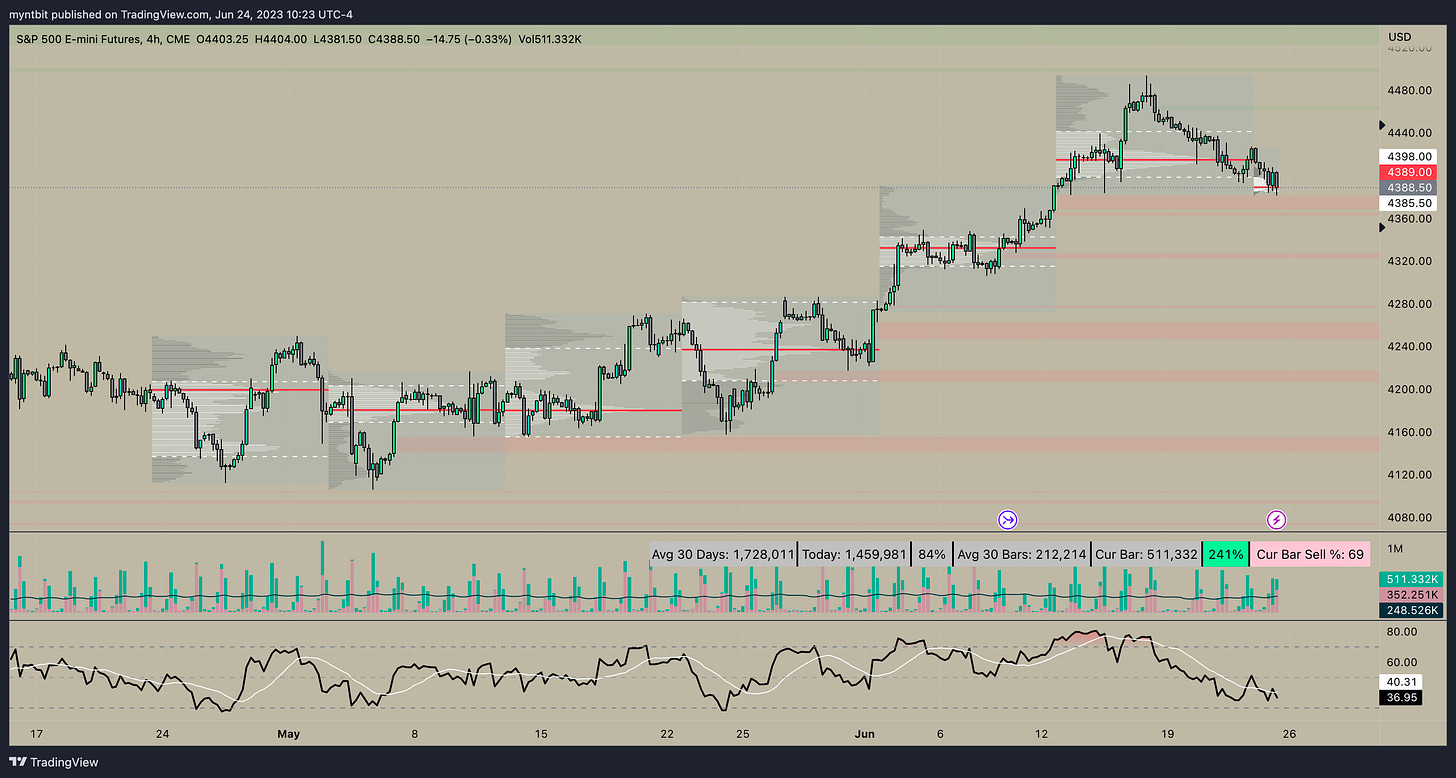
/ES - Emini S&P 500
🐂 Upside: Maintaining the 4400 level may encourage an upward move towards 4414. If there is a breakthrough above this level, the target could be set at 4440-4460. 4460 is key for bulls for further upside.
🐻 Downside: If the position above 4400 cannot be sustained, there is a chance of revisiting and testing the 4380 level. Failing to hold that as support could lead to a further test of 4360. 4330 should act as a key support.
Options Analysis
Volume: the volume for EOM expiry (June 30th) is 100,084 puts vs 41,080 calls suggesting a bearish sentiment. If we look closer at the volume for 50 strikes closer to the current ES price, it gives us an idea of key levels: 4300, 4350, 4400, 4450
Open Interest: the option interest for EOM expiry (June 30th) is 471,119 puts vs 181,225 calls again confirming a bearish sentiment. If we look closer at the OI for 50 strikes closer to the current ES price, it gives us an idea of key levels: 4300, 4350
Expected Move: Above OI & Vol suggested a bearish sentiment and the expected move for ES for the upcoming week is listed below.
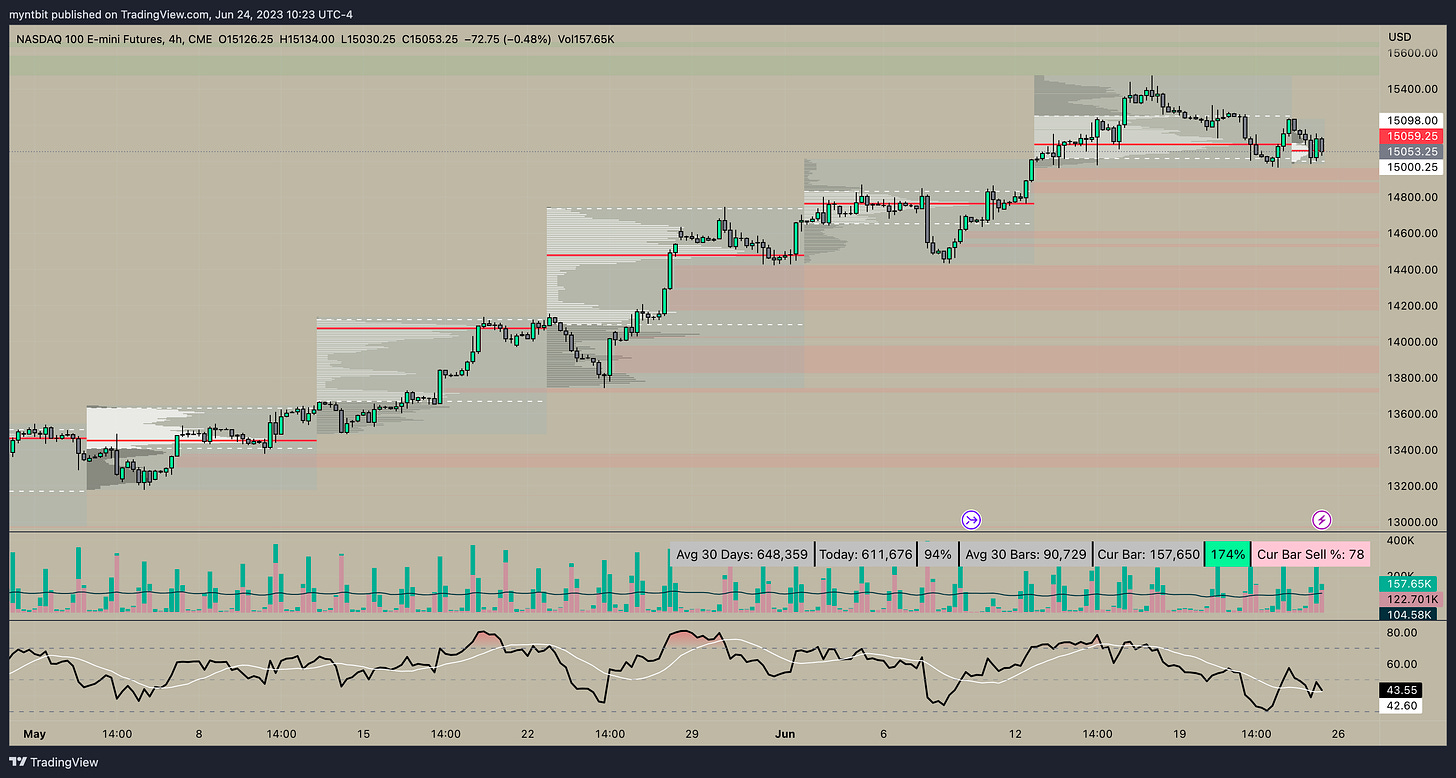
/NQ - Emini Nasdaq 100
🐂 Upside: If we are able to maintain a position above the 15000 level, there is a possibility of testing the 15200 mark. If we successfully surpass this level, it may result in additional gains, with the next resistance level identified at 15500.
🐻 Downside: If the price fails to stay above 15000, it may decline towards the 14850 mark. If it breaks below this level, it would trigger a test of the significant support level at 14750.
Options Analysis
Volume: the volume for EOM expiry (June 30th) is 3240 puts vs 2519 calls suggesting a slightly bearish sentiment. If we look closer at the volume for 100 strikes closer to the current NQ price, it gives us an idea of key levels: 15100
Open Interest: the option interest for EOM expiry (June 30th) is 13,365 puts vs 14,514 calls a slightly bullish sentiment. If we look closer at the OI for 100 strikes closer to the current NQ price, it gives us an idea of key levels: 14950
Expected Move: Above OI & Vol suggested a mixed sentiment and the expected move for NQ for the upcoming week is listed below.
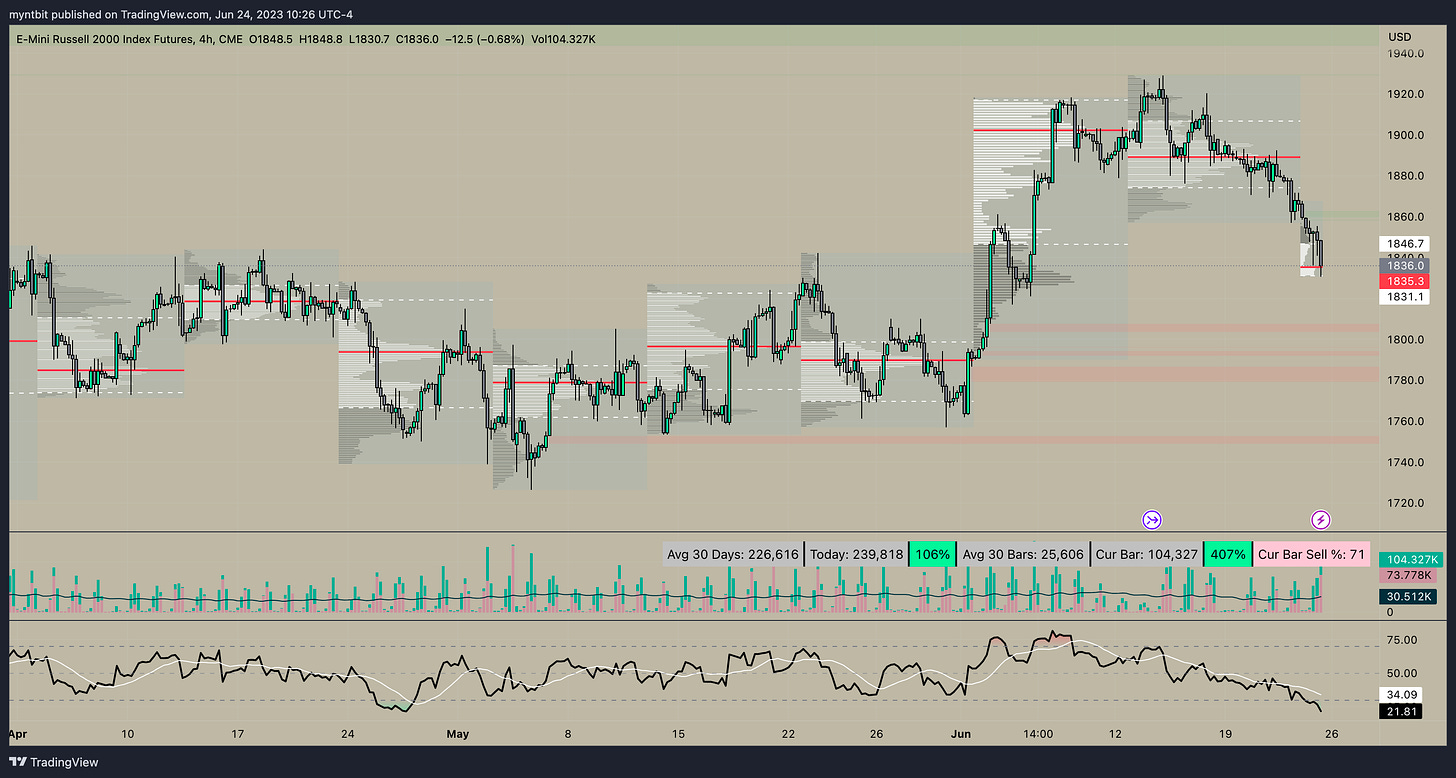
/RTY - Emini Russell 2000
🐂 Upside: In case the price remains above 1830, there is a possibility of testing 1850 which is a significant level but if we manage to break above that the next level is 1870.
🐻 Downside: However, if the price falls below 1830, it could lead to a decline toward 1820 and then a possible test of a critical support level at 1800.
Small Caps are the weakest in relation to the rest of the market.
Options Analysis
Volume: the volume for EOM expiry (June 30th) is 269 puts vs 292 calls suggesting a mixed sentiment on low volume. If we look closer at the volume for 50 strikes closer to the current RTY price, it gives us an idea of key levels: 1850
Open Interest: the option interest for EOM expiry (June 30th) is 15,482 puts vs 3,797 calls again confirming a bearish sentiment. If we look closer at the OI for 50 strikes closer to the current RTY price, it gives us an idea of key levels: 1750, 1775
Expected Move: Above OI & Vol suggested a mixed sentiment and the expected move for RTY for the upcoming week is listed below
Stocks
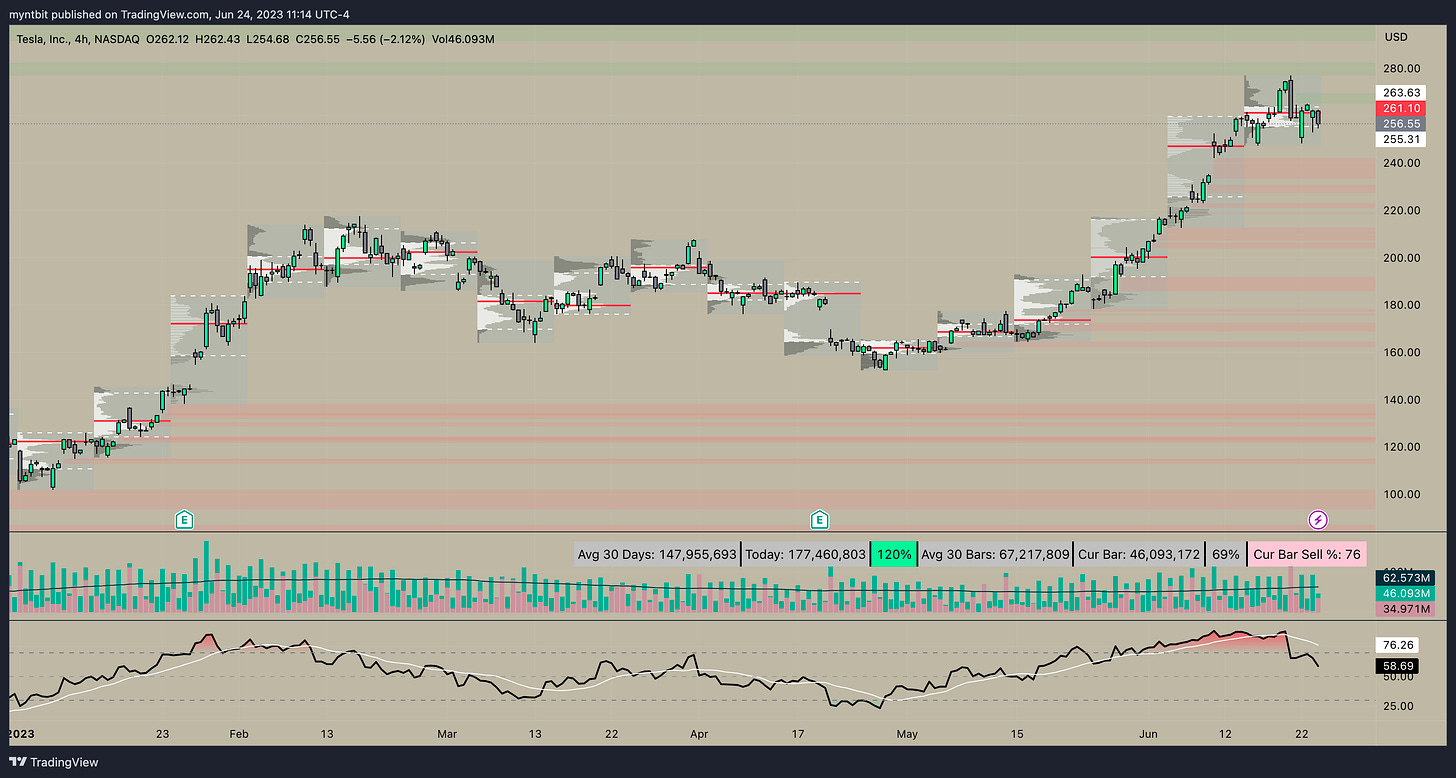
TSLA - Tesla, Inc.
Currently, TSLA is overbought based on our oscillators. TPO shows that TSLA single print was closed at 276 next single print that TSLA will close is at 236.
🐂 Upside: if the current price holds it could target 259.21 with upside targets at 265.09, 267.11
🐻 Downside: once it breaks 246.73, it will go down to close single print/gap at 236
Analyst Ratings
Options Analysis
Volume: the volume for Jun 30 till Jul 21 weekly expiry is 464,006 puts vs 669,635 calls suggesting a bullish position. If we look closer at the volume for 25 strikes closer to the current TSLA price, it gives us an idea of key levels: 250, 255, 260
Open Interest: the option interest for Jun 30 till Jul 21 weekly expiry is 987,986 puts vs 842,853 calls suggesting a bearish sentiment. If we look closer at the OI for 25 strikes closer to the current TSLA price, it gives us an idea of key levels: 220, 250, 260
Expected Move: the expected move for TSLA for the upcoming week and the next few weeks are listed below.
SQ - Block, Inc.
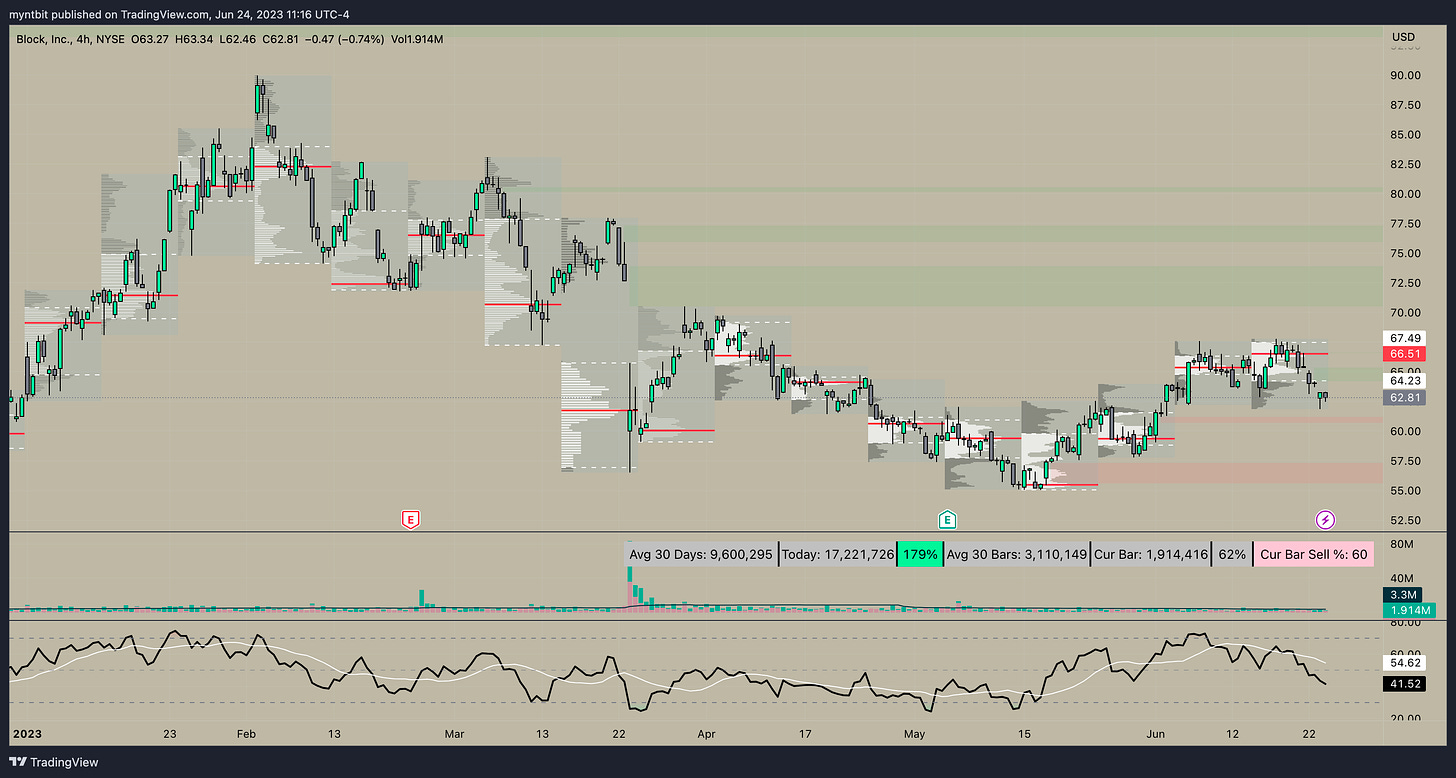
🐂 Upside: 63.22, 64.04, 64.95 (might be a strong resistance). If 64.95 resistance is overcome then SQ might close a single print at 72.24
🐻 Downside: 61.91 seems to be strong support and if it loses this support, the next one is at 60.43 and 60.06, 59.29. If 59.29 is broken then SQ might head more downwards to close single prints there.
Analyst Ratings
Options Analysis
Volume: the volume for Jun 30 till Jul 21 weekly expiry is 14,445 puts vs 21,870 calls suggesting a bullish position. If we look closer at the volume for 25 strikes closer to the current SQ price, it gives us an idea of key levels: 60, 80
Open Interest: the option interest for Jun 30 till Jul 21 weekly expiry is 50,403 puts vs 61,433 calls suggesting a bullish sentiment. If we look closer at the OI for 25 strikes closer to the current SQ price, it gives us an idea of key levels: 55, 70
Expected Move: the expected move for SQ for the upcoming week and the next few weeks are listed below.
AMZN - Amazon.com, Inc.
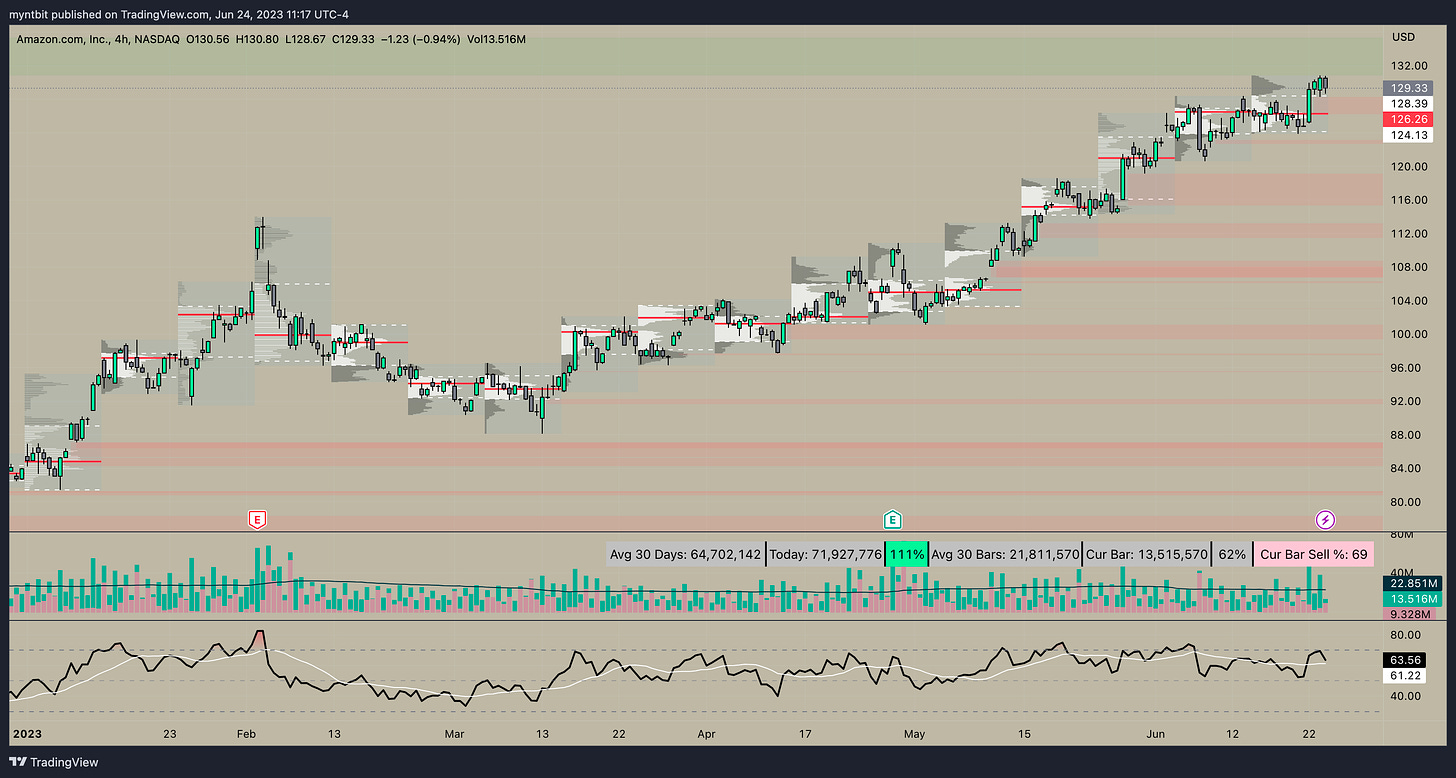
🐂 Upside: if we hold the current price the next target above 131.25 to test 133.71, 136.35 and 140
🐻 Downside: if the price can't hold the current level the next targets are 127.23, 126.35, 124.65, and 123.46.
Analyst Ratings
Options Analysis
Volume: the volume for Jun 30 till Jul 21 weekly expiry is 136,021 puts vs 385,385 calls suggesting a bullish position. If we look closer at the volume for 25 strikes closer to the current AMZN price, it gives us an idea of key levels: 125, 130
Open Interest: the option interest for Jun 30 till Jul 21 weekly expiry is 468,621 puts vs 638,561 calls suggesting a bullish sentiment. If we look closer at the OI for 25 strikes closer to the current AMZN price, it gives us an idea of key levels: 125
Expected Move: the expected move for AMZN for the upcoming week and the next few weeks are listed below.
Follow us on Twitter!
Updates will be provided on Twitter throughout the week (link is below)
Disclaimer: This newsletter is not trading or investment advice, but for general informational purposes only. This newsletter represents our personal opinions that we share publicly for educational purposes. Futures, stocks, and bonds trading of any kind involves a lot of risks. No guarantee of any profit whatsoever is made. In fact, you may lose everything you have. So be very careful. We guarantee no profit whatsoever, You assume the entire cost and risk of any trading or investing activities you choose to undertake. You are solely responsible for making your own investment decisions. Owners/authors of this newsletter, its representatives, its principals, its moderators, and its members, are NOT registered as securities broker-dealers or investment advisors either with the U.S. Securities and Exchange Commission, CFTC, or with any other securities/regulatory authority. Consult with a registered investment advisor, broker-dealer, and/or financial advisor. By reading and using this newsletter or any of my publications, you are agreeing to these terms. Any screenshots used here are courtesy of ForexFactory, Unusual Whales, Finviz, ThinkorSwim, and/or Tradingview. We are just end-users with no affiliations with them.


